Index-Specific Drivers Total Engagement
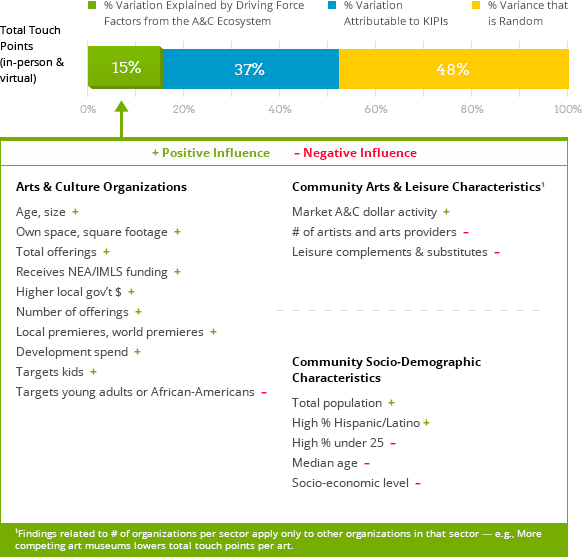
What Drives Total Engagement (in-person and virtual)?
What Drives Total Engagement?
What organizational characteristics affect this performance?
-
More engagement emerges for organizations that are older, own their space, with larger budgets, have more square footage, or provide more program offerings.
-
Local and world premieres elevate the number of total touch points.
-
Organizations that spend more on fundraising and those that target kids engage more people, and those targeting African-Americans or young adults engage fewer.
-
Local funding support increased engagement figures while state dollars had no effect, and the number of NEA and IMLS grants had a positive effect on an organization’s number of total touch points.
How do community arts and leisure characteristics affect performance?
-
Any individual organization’s number of total touch points is negatively affected by the number of leisure activities. Evidently, there are strong effects between arts and cultural organizations and substitute leisure activities when it comes to participation.
-
As the percentage of independent artists and arts providers in the community increase, total touch points go down.
-
There are no competitive effects from similar organizations in the same sector, and total arts revenue per capita in a sector drives up total touch points for organizations.
How do socio-demographic characteristics of the community affect performance?
-
The higher the population, the greater the general presence of people under 25 years old in the market, and the higher the median age in the market, the lower total touch points.
-
The higher the percentage of the population Hispanic/Latino, the higher the touch points.
-
The more households with income $200,000 and above, the lower total engagement, perhaps a reflection of this segment and limited time.
What Drives In-Person Engagement (live participation, only)?
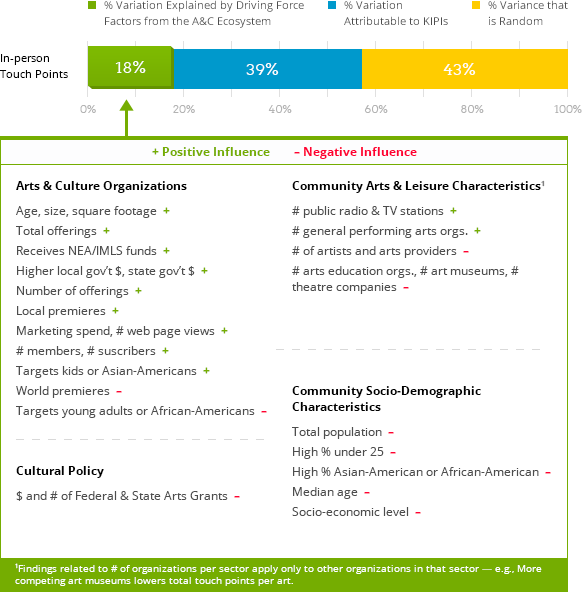
What Drives In-Person Engagement?
What organizational characteristics affect this performance?
-
The total number of in-person touch points rises with organizational age, budget size, square footage, and number of program offerings provided.
-
Local premieres elevate the number of in-person touch points while national or world premieres lower it.
-
Organizations that spend more on marketing, attract more people to view their web pages, have more members or subscribers, and target kids or Asian-Americans engage more people, and those targeting African-Americans or young adults engage fewer.
-
Local and state funding support increased in-person engagement figures, and the number of NEA and IMLS grants had a positive effect on an organization’s number of in-person touch points.
How do community arts and leisure characteristics affect performance?
-
Public broadcast dollar activity boosts in-person engagement. Any individual organization’s number of total touch points is negatively affected by the number of artists and arts providers in the market.
-
The more arts education organizations, art museums or theatre companies in a market, the lower the in-person engagement by organizations within these sectors. Within-sector competition in general performing arts tends to increase the total touch points of organizations in that sector.
How do socio-demographic characteristics of the community affect performance?
-
The higher the population, the greater the general presence of people under 25 years old in the market, and the higher the median age in the market, the lower total touch points.
-
The higher the percentage of the population Asian-American or African-American, the lower the number of in-person touch points.
-
As socioeconomic levels increase, total touch points go down.
What impact does cultural policy have on performance?
-
Higher levels of state and federal government grant activity in the local market are associated with lower total in-person touch points.