At What Cost? How Distance Influences Arts Attendance
By Glenn Voss, NCAR Research Director, Zannie Voss, NCAR Director, and Young Woong Park, NCAR Research Fellow
The authors wish to thank the Doris Duke Charitable Foundation for its support of Dr. Park’s position and this research
Download the Report (PDF)
The American Alliance of Museums recently asked a group of museum CEOs, “What do you need to know (more) to strengthen your institution’s audience-building results?” Two responses summed up the general reactions: 1) “Behavioral patterns, decision-making prompts,” and 2) “What perceived value would attract prospective attendees?”
Perceived value is critical to understanding why people decide to act or not to act. The tagline of the communications strategy firm Maslansky + Partners says it all: “It’s not what you say, it’s what they hear.” In order to break through to cultural consumers, we have to speak to their truth, not our truth.
We naturally give heavy emphasis to the benefits of attending when we market the arts. We promote the excellence and uniqueness of our offerings. After all, even if two theatre companies in the same market, for example, both produce contemporary plays, at any given moment in time they will offer different plays with distinct casts, directorial approaches, and design elements. This is our truth. Given this uniqueness, we would like to believe that people will come from far and near to see what they can only see by coming to witness our work.
Yet perceived and real benefits are only half of the value equation from the customer’s standpoint. Their truth includes not only benefits, but also costs. Even if perceived benefits are sufficient to entice someone to consider attending, that person will weigh the attractiveness of those benefits against the monetary price of admission and non-monetary costs such as investment of time, not knowing where to go, the hassle of parking, etc. Influencing the decision of whether or not to attend requires concentration on both elements of the customer’s calculus: increasing real and perceived benefits and decreasing real and perceived costs.
Arguably, there are few elements of organizational success that are more important but less appreciated than location. Location with respect to customers determines market potential, or the number and relative size of households in an organization’s trade area. Since live participation is a basic characteristic of most arts and cultural offerings, it makes sense to consider how far people will travel to attend. All else being equal, the cost of attending naturally increases as a household’s distance from the organization increases, so that a household’s likelihood of attending decreases. The onerous nature of travel time is exacerbated in markets with low walkability, where efficient public transportation is not a viable option, and commute times are high.
But what distances are relevant, and to what extent do community and household characteristics influence the relationship between distance and likelihood to purchase? And which other factors in the marketplace affect patronage, and how?
While consumer behavior research often captures the attitudes and perceptions of individuals through surveys, interviews or focus groups, there is something to be learned by simply observing human behavior. Through their behavioral patterns, people divulge a lot of information about their interests and the things that stand in the way of connecting with those interests. In this paper we seek insight regarding the critical factors that influence the patronage behavior of cultural consumers, highlight some barriers and opportunities in attracting cultural audiences, and offer potential implications for strategic marketing decisions.
Their Truth #1: “If it’s not in my neighborhood, I’m much less likely to go.”
To explore the extent to which distance is relevant in the decision to attend the arts, we examined box office data in five markets, obtained through partnership with TRG Arts, for a total of 90 visual arts, performing arts, and community-based organizations.[1] These organizations collectively served 2.4 million unique households that completed 7.9 million transactions. The average number of transactions for these organizations was 21,900 per year, which equates to roughly one ticket per household in their box office data per year. We pinpointed the location of each household and assigned it to its census tract to infer information about commute times, income, and educational attainment,[2] calculated distances between each census tract and each organization, and kept all households in census tracts located within about 43 miles (70 kilometers) of the nearest organization.
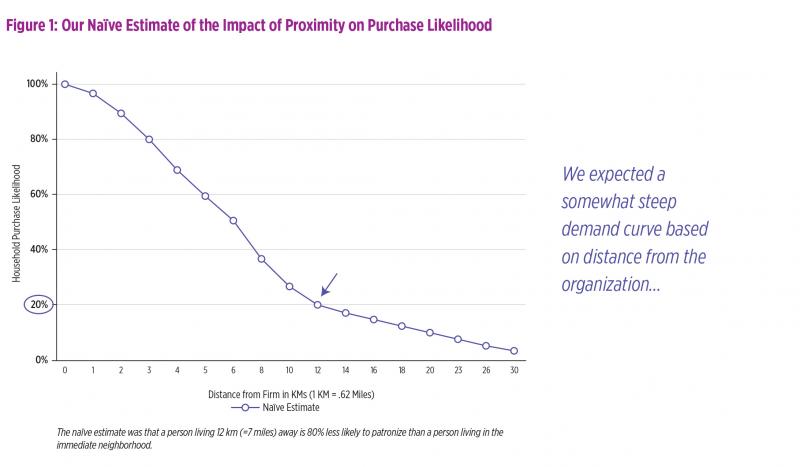
Our research reveals that the arts are radically local. We expected distance to play a role as a cost in the value calculus, but we underestimated just how much location weighs in the decision to act or not to act. Based on an exploration of related research in retail settings, we initially estimated that a person living roughly 7 miles (12 kilometers) from an arts and cultural organization would be 80% less likely to attend than a person living in the organization’s immediate neighborhood (Figure 1).[3]
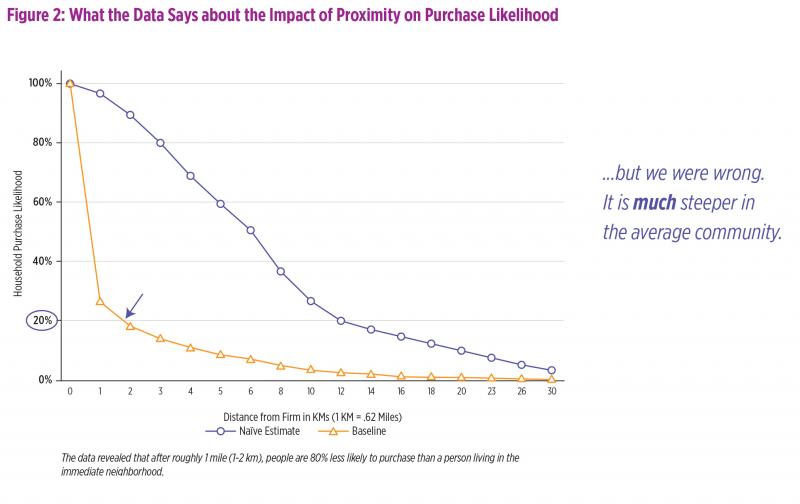
Analysis of the data revealed that, in the average community, a more accurate estimate is that patronage likelihood drops off by 80% at around 1 mile from the organization – not 7 miles (see the Baseline curve in Figure 2). The curve is different for each city and the differences can be explained by the effect that community characteristics have on purchase likelihood.
Their Truth #2: “I’d be more likely to go if I had more time and money.”
One community characteristic that influences cost perceptions is average commute time. In communities where commute times are long, the arts become even more radically local. It makes sense that if people spend long stretches of their day in a car or on a subway commuting to and from work, they are more likely to see distance to the arts organization as a deterrent. For example, at a distance of just under a mile (1 kilometer) from the organization, the relative purchase propensity is 5% higher in communities facing short commute times compared those facing long commute times.[4] However, relative differences actually increase with distance so that propensities for households 30 kilometers away are approximately 60% more or less likely to attend if they face short versus long commutes.
Socioeconomic characteristics also figure heavily in perceptions of distance as a cost in the value calculus. Figure 3 shows the big difference in purchase likelihood for high socioeconomic (blue line) versus low socioeconomic (red line) neighborhoods at different distances. We know, however, that neighborhoods in most communities do not share the same income and education levels. The low-high (purple) socioeconomic curve gives a sense of what the graph looks like for an arts organization with low socioeconomic neighborhoods in the immediate surrounding areas, high income and education enclaves located 4-6 kilometers from the organization (2.5 to 4 miles), and low socioeconomic neighborhoods beyond.
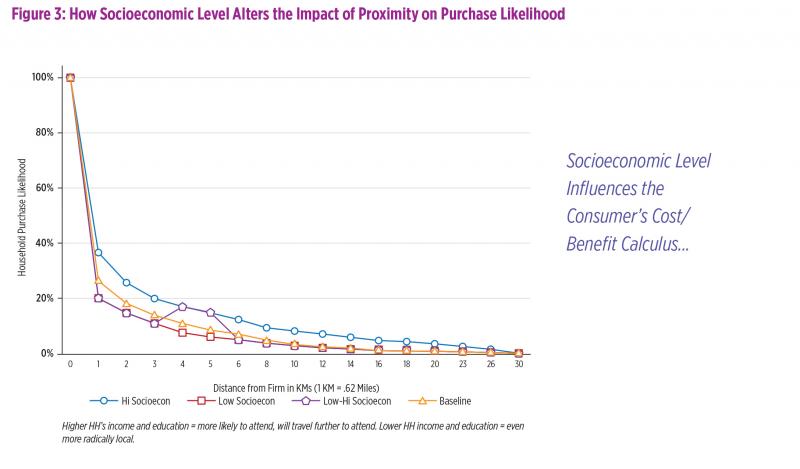
Households with higher income and education are more likely to attend and more willing to travel greater distances to attend. Households with lower income and education are still willing to attend, though, especially if it’s in the neighborhood. Not surprisingly, the arts become even more radically local for those in low socioeconomic communities as non-monetary costs such as the hassle of travel compound the financial barriers of attending. Figure 3 shows that higher levels of income and education increase likelihood of purchase regardless of distance, while lower socioeconomic status reduces likelihood of purchase, but to a lesser degree. At a distance of about a mile (1-2 kilometers), the model shows an 11% bump in purchase likelihood for high socioeconomic neighborhoods (38% compared to the baseline of 27%), while there is a corresponding 6% drop to 21% in likelihood to purchase for low socioeconomic neighborhoods. At 30 kilometers, propensities in low (high) socioeconomic neighborhoods are nearly 50% below (above) the baseline.
Density of population has a modest effect on purchase likelihood. This is especially the case at shorter distances, where high population density translates into slightly lower propensities but more overall transactions attributable to more households. The negative effect of density is more pronounced at greater distances. For example, at 30 kilometers, propensities in high-density neighborhoods are nearly 50% below the baseline whereas propensities in low-density neighborhoods are only 17% higher than the baseline. The further away a household in a densely populated neighborhood is to an arts organization, the lower their propensity to purchase. At the same distance, a household in a low-density neighborhood has a higher propensity to purchase.
Their Truth #3: “What I really want is a destination for an entire day or night out, even if it means a longer drive.”
To explore the extent to which the proximity of other attractions in the marketplace affects patronage, we looked at complementary leisure activities, including bars, restaurants, and hotels per capita. When these complements are located near arts organizations, they collectively create an arts and leisure destination, which in turn enhances perceived benefits and increases the likelihood of attendance, especially for neighborhoods at further distances. Arts and cultural organizations located in areas that are bustling with leisure complements benefit from an overall increase in purchase likelihood and they are able to attract more people from greater distances.
In fact, the model shows that organizations surrounded by a high level of leisure complements get a bump of about 5% above the baseline purchase likelihood from all neighborhoods located within about 3 miles (5 kilometers). The purchase likelihood curve stays above that of the baseline at all distances. For example, purchase likelihood in neighborhoods located 30 kilometers away is nearly 60% higher if the arts and cultural organization is surrounded by a high level of leisure complements and about 60% lower if the inverse is true.
This means we are observing two things. In the purchase bump at closer distances, we are seeing the enhancement of perceived benefits associated with arts attendance when it can be coupled with dinner nearby or a drink afterwards. At further distances, we are seeing the reduction of perceived costs of travel if it means having a full day or night out in a dynamic destination environment.
Their Truth #4: “The more arts activity there is near my home, the more likely I am to attend.”
To investigate how the presence of other arts and cultural organizations in the market affects patronage, we looked at both the intensity of arts activity (measured as total arts and culture expenditures per capita) and the relative concentration of arts and culture activity across the entire market from the perspective of the household. High-intensity markets feature high levels of arts and culture activity. Concentrated markets feature intense activity in a single geographic location, such as an arts district, whereas non-concentrated markets feature dispersed activity throughout the market. The industry concentration measure is relative to population concentration. The intuition for the measure is that if arts organizations and the population are equally dispersed, arts patrons are less motivated to travel longer distances to attend a particular arts venue because they have other options closer to home.
Purchase likelihood is generally higher in neighborhoods featuring intense arts and culture activity, especially at shorter distances. This result might seem obvious at first glance, but remember we are looking at purchase likelihoods for individual organizations. Because increased arts and culture expenditures per capita are likely associated with increased numbers of competitors, this result implies that households are generally more likely to attend the arts in high-arts-activity communities. It may be the case that people who are drawn to arts and culture choose to live in communities where there is an abundance of activity. It also may be that the preponderance of arts and cultural activity encourages an arts-going habit in local residents.
The effects for arts and cultural activity concentration are logical but not immediately intuitive so we rely on a simple example to explain. In Figure 4, we depict three different hypothetical markets where we assume overall arts activity and population distributions are equal. Each market has the same number (9) of neighborhoods where people live and the same number (9) of arts and cultural organizations. In Panel A, the arts and cultural organizations are completely diffused across neighborhoods. Panel B depicts partial diffusion (and some concentration) of organizations. Panel C depicts complete concentration within a single neighborhood.
In low-concentration markets (Panel A), households prefer to patronize the nearest organization and, because there are no immediate competitors, purchase likelihoods are elevated for the closest households. In our results, purchase likelihoods in low-concentration markets are elevated as much as 5% above the baseline at distances less than 2.5 miles (4 kilometers). Beyond 2.5 miles, purchase likelihoods drop below the baseline because arts organizations in bordering neighborhoods become more attractive.
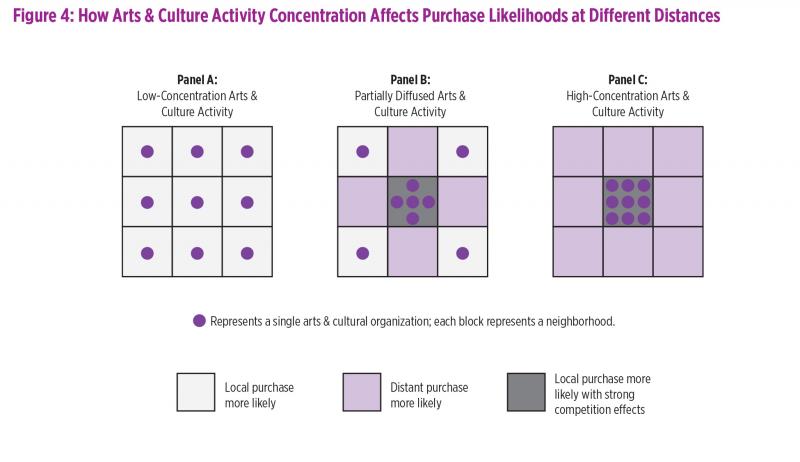
In high-concentration arts and culture markets (Panel C), households in the immediate high-concentration neighborhood have 9 different organizations to choose from, so that the purchase likelihood for any single organization in the cluster drops below the baseline for households at distances of less than 2.5 miles (4 kilometers) away. Outlying neighborhoods have no local arts and cultural organizations, which translates into elevated purchase propensities for neighborhoods located further than 2.5 miles away from a highly concentrated arts district. Practically speaking, they have no other choice if they want to be an arts consumer. Our results indicate that purchase likelihood in neighborhoods located 30 kilometers away are double the baseline level in high-concentration arts and culture markets.
Combining the findings related to intensity and concentration of arts activity, we learn that customers respond well to nearby availability of dispersed activity. All else being equal, in a market with high arts activity, people are more likely to attend, and they are more likely to attend closer to home if there are arts organizations located nearby. Given the choice, people demonstrate a preference for staying in the neighborhood. When they have no choices nearby but do have access to a distant, concentrated arts district, they are more likely to travel than if they had closer options.
We would like to emphasize that the positive purchase likelihood effects discussed here apply to intensity of arts activity near to residential areas. They resemble characteristics Stern and Seifert (2007) use to describe “natural” cultural districts, which are neighborhoods that include concentrations of cultural providers and cultural participants.[5] The positive effects do not carry over to singular concentrations of arts and cultural organizations in industrial or commercial areas that lack proximity to housing. This takes nothing away from the power of arts and cultural organizations as catalysts for economic development. It simply means that organizations located without an adjacent residential neighborhood don’t realize the bump in purchase likelihood that might otherwise come from those living nearby. Our findings here also resonate with recent research showing that economic impact is most positive in cities where several cultural clusters are widely scattered over the metropolitan area.[6]
Where Are the Opportunities?
So how do you use this information to inform strategic decisions? Our research reveals that the arts are radically local. Distance weighs quite heavily in a patron’s decision to act or not to act. The implications for urban planning of arts districts are clear: all else being equal, arts organizations located in areas devoid of adjacent residential neighborhoods will likely struggle to build purchase likelihoods. Yet there are implications for leaders of arts and cultural organizations as well. The fact that there is a much higher likelihood of purchase among households in an arts and cultural organization’s immediate neighborhood means that those living nearby should take on added importance. An opportunity lies in organizations making even greater efforts to be good community citizens. We regularly consider what the local community is doing for us, but what do we do for the community?
This is a time to recognize that being community-focused and paying close attention to people living nearest to the organization can be an advantage. Organizations that are, by design, community-based – e.g., multipurpose arts and cultural organizations, cultural and ethnic awareness organizations, folk arts, community celebrations, etc. – have a head start. Ron Chew’s report titled Community-based Organizations: A New Center of Gravity provides compelling insights on the richness and value of these culturally grounded groups to their communities.[7]
Many organizations, even those that attract people from much farther afield, have already figured this out and offer great examples of meaningful community partnerships. For example, the majority of the Whitney Museum of American Art’s Community Partnerships are with organizations located within a mile of the museum. Its education department has also established WECAN:
“The Whitney Education Community Advisory Network (WECAN) is a group of local residents, teachers, parents, and representatives from social service providers and community-based organizations in the Whitney’s neighborhood in downtown Manhattan. Through regular meetings of WECAN, we involve our neighbors in an ongoing dialogue exploring ways that the Whitney can be an essential resource for this diverse and dynamic community.” -- http://whitney.org/Education/Community/NewNeighborhoodInitiatives
We can carry this strategy through to active participation in local retail development and to cultivation of natural neighborhood cultural districts, which are the fruit of self-organizing cultivation efforts.[8] Arts and cultural organizations can take an active, institutional leadership role to attract other arts organizations and other leisure businesses like local restaurants and bars to co-locate. This might entail first-hand involvement in neighborhood associations, chambers of commerce, community development corporations, and the like. It can be seeded through organization of small-scale festivals that invite the neighborhood, the participation of other companies, and a mix of arts disciplines. It can arise through co-productions, co-presentations, or other collaborative projects that generate more visibility than a single organization would normally achieve alone while spreading fixed costs over multiple, local organizations. It may take leveraging the connections of board members and patrons who care about the organization and the long-term sustenance of its immediate surroundings. The path that makes most sense to pursue will likely vary given local conditions. It is important, though, to recognize that organizations have the power to shape their environment as well as be shaped by it.
Another opportunity lies in thinking about how organizations can take their act on the road to reduce real and perceived costs for target audiences. Rather than put the onus on prospective participants to bear the cost of coming to us, how can we take our mission-related work to them? For example, we know from the NEA’s 2015 report When Going Gets Tough that Mexican-Americans who were interested non-attendees were more likely to report difficulty getting to the location as a barrier to their attendance.[9] Armed with this information, can organizations make it easier for interested non-attendees who share this perception to engage with the organization’s work by bringing the location to them? Think of it like developing a friendship. If you don’t live nearby someone but really want to spend time with them, you don’t insist that they always come to you. And yet we are flummoxed when we have something exceptional to offer and people who live further away, put up with a long daily commute, and have average income and education just won’t come.
Again, there are great examples of organizations that have already figured this out. CalArts Community Arts Partnerships are offered at public schools, community centers and social service agencies, covering a 1,000-square-mile radius across Los Angeles County. Orchestras from Rhode Island and New Jersey to Georgia to California offer summer outdoor concert series in various locations. Opera Philadelphia’s “O17” is designed to reinvent the urban opera experience through a 12-day festival featuring seven “operatic happenings” at six venues across the city.
There is a more global lesson regarding costs. Location is only one of a myriad of barriers to attending. Meeting needs requires listening to those whose behavior you seek to influence. Understanding the factors at play in a patron’s calculus of whether to engage or not to engage with your organization is at the very heart of understanding what drives behavior. Are you missing opportunities to better satisfy the needs of those whom you seek to serve, and to remove both real and perceived barriers to attendance? We will have a more robust future if we take into account the reality of consumers’ truths and respond proactively.
Follow @artsresearch for more.
[1] The breakdown of the organizations was eight museums of various types (e.g., art, science, youth, etc.), 17 community-based organizations (e.g., arts education, arts centers, arts festivals), and 65 performing arts organizations, including theaters, symphonies, opera companies, dance companies, and performing arts centers.
[2] A census tract is a well-defined, small geographic area that closely approximates a neighborhood and contains between 1,200 and 8,000 people, averaging 4,000. Census tracts are the building blocks of counties, they canvas the entire United States, and they typically cover smaller geographic areas than zip codes so they provide more granular and robust demographic-economic detail than zip codes.
[3] 100% purchase likelihood is scaled to reflect an organization’s maximum market penetration rate; it does not mean that 100% of households within 1 kilometer of the organization will purchase, nor does it mean that 100% of the organization’s transactions come from that distance. For example, if an organization’s market penetration within 1 kilometer is 10%, it means that 100 of every 1,000 households within 1 kilometer (km) attend. The curve also tells you penetration rates at greater distances; e.g., 20% likelihood x 10% penetration = 2%, which equates to 20 of every 1,000 households at 12 km attending. Keep in mind, though, that the distances form concentric circles around the organization that increase in size at greater distances. The area of the ring of households 1-2 km away is greater than the area enclosed by the 0-1 km inner circle, so there will be more households in the 1-2 km range (all else being equal). This means that while the likelihood of a household attending decreases with distance, it applies to a much larger pool of households. In fact, we estimate that the average organization’s highest percentage of total purchase transactions comes from the 2-3 km range.
[4] For all comparisons of low versus high, we define low as one standard deviation below the mean and high as one standard deviation above the mean. For example, the average commute time in the U.S. at the time of our study was 25.1 minutes and the standard deviation was around 7, so a short commute time is defined as 18.1 minutes and a long commute time is defined as 32.1. The Baseline represents propensities for neighborhoods facing average commute times.
[5] Stern, M. J. and S. C. Seifert, Cultivating “Natural” Cultural Districts, Philadelphia: Reinvestment Fund, 2007. We note that while the nature of and impetus for formation of cultural clusters is key to their definition as “natural” by Stern and Seifert, observations regarding how cultural clusters form are beyond the scope of this study.
[6] Sheppard, S., Culture Concentrations: The Spatial Structure of Arts Nonprofits, Williamstown, MA: Center for Creative Community Development, 2013.
[7] Chew, R., Community-based Arts Organizations: A New Center of Gravity, Washington, DC: Americans for the Arts, 2009.
[8] Stern, M. J. and S. C. Seifert, Cultivating “Natural” Cultural Districts, Philadelphia: Reinvestment Fund, 2007.
[9] Blume-Kohout, M. E., S. R. Leonard, J. L. Novak-Leonard, When Going Gets Tough: Barriers and Motivations Affecting Arts Attendance, National Endowment for the Arts, Research Report #59, January 2015.