What is the reach of our community engagement, first looking at in-person and virtual participation then at in-person engagement only?
-
- VIEW AVERAGES BY:
- Overall
- Arts Sector
- Size
- Geography
-
What We Learned

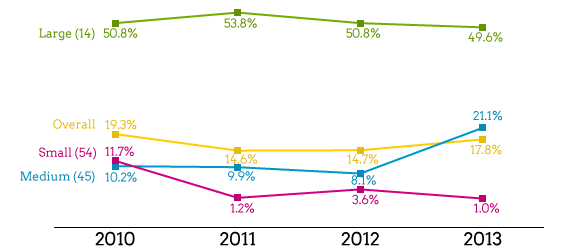
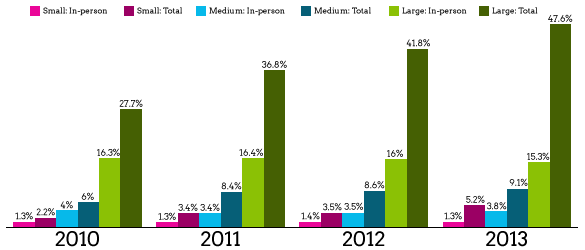
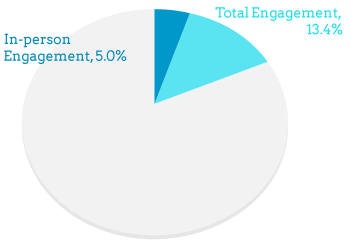
If we include audiences for online or digitally-transmitted programming, the average arts and cultural organization engaged the equivalent of 13.4% of its local population. If we include in the mix only audiences who attended programming in-person, the community engagement average is 5.0% of the organization’s local population. Findings suggest that some sectors are increasing their importance as digital art forms in terms of engagement
The community engagement measure – what we refer to as ‘total touch points’ -- throws a wider net to capture all stakeholder interaction with the organization. It includes everything from volunteers to artists to donors to audiences. In-person touch points for all organizations in 2013 averaged 41,499 and total touch points – adding in virtual engagement -- averaged 111,277. We note that available data provide us with the number of touch points, not the duration, depth or quality of engagement each person has with the organization.
We use spatially-adjusted total population as a point of comparison to see how many people engage with the organization and its programs compared with the population of the organization’s local community. The average spatially-adjusted population – what we use when we refer to “population” -- was 830,379.
2013 Overall Averages Ave. Total Touch Points (in-person and virtual)/ 111,277 Ave. Population 830,379 Ave. In-person Touch Points (excludes virtual)/ 41,449 Ave. Population 830,379 -
Arts Education
Total Touch Points (in-person only)
21,863
Population
885,287

What We Learned
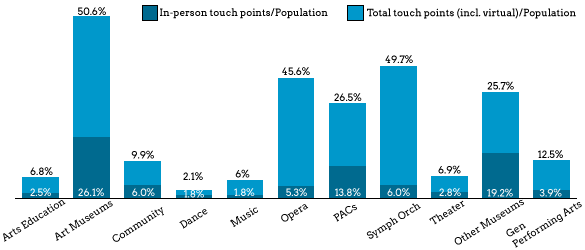
• Art Museums had the highest community engagement, whether or not virtual participation was taken into account. They engage about half of their total touch points in-person and half virtually. In absolute terms, compared to other sectors they have the highest average number of touch points, both in-person and total.
• Other Museums had the second highest level of in-person engagement and in-person touch points. Virtual engagement plays a lesser role for Other Museums than it does for Art Museums.
• The Arts Education, Music, Opera, PAC, Symphony Orchestra, Theater, and General Performing Arts sectors now touch more people in a digital space than they do on site. These sectors are actively developing a virtual following.
• Opera companies and Symphony Orchestras both engage far more people through digital offerings than in-person: both sectors engage 12% of their total touch points in-person and 88% virtually. While the live experience is an essential and irreplaceable aspect of these art forms, they now hold an important existence as digital art forms in contemporary society.
-
Small Organization
Total Touch Points (in-person only)
9,357
Population
752,717

What We Learned
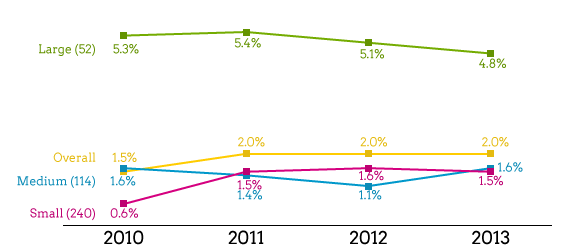
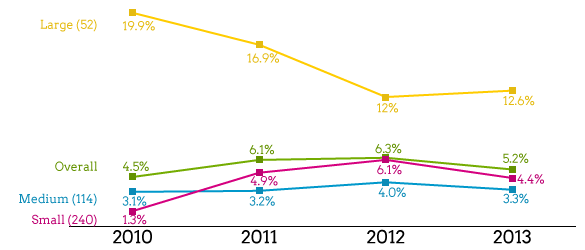
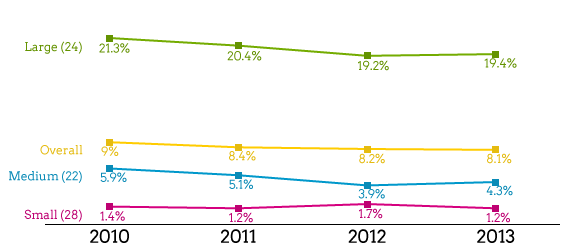
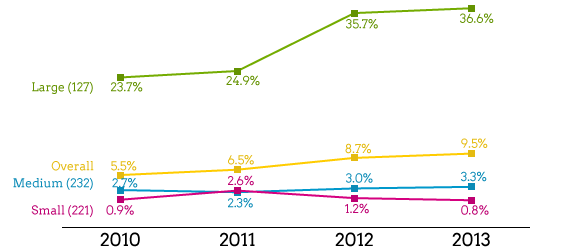
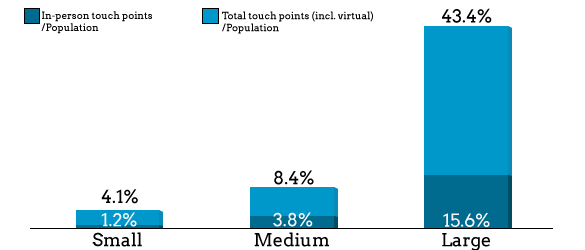
• The percentage of people an organization touches relative to the local population doubles on average as organizations go from Small to Medium. It increases four-fold as organizations go from Medium to Large when considering in-person attendance only, and five-fold when we include virtual attendance.
• Organizations of all sizes engage people in virtual participation through digital programming.
• The larger the organization, the more densely populated the local community in which it operates. It may be that, in most cases, budget growth is contingent on reaching a critical mass in the local population. The increased density of individuals means more prospective stakeholders of every kind.
-


Filter markets by:
AVERAGE%View List of Markets »- New York-White Plains-Wayne, NY-NJ;
- Los Angeles-Long Beach-Glendale;
- Chicago-Naperville-Arlington Heights;
- San Francisco-Redwood City-So. S.F.;
- Washington-Arlington-Alexandria-Bethesda-Rockville-Fredericksburg

What We Learned
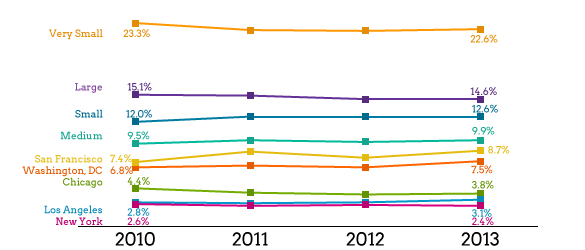
• While organizations in New York have the highest average total touch points and Very Small Markets the lowest, it is not surprising that organizations in Very Small Markets have the highest market penetration and those in New York the lowest given their radical differences in local population density.
• The highest average in-person touch points per organization can be found in Large Markets, followed by New York.
• There is higher spatially adjusted average population in Medium Markets than in Large Markets due to differences in population density. The Medium Markets tend to have lower total population than Large Markets; however, Large Markets tend to have more dispersed populations than Medium Markets (e.g., Phoenix compared to Boston), so the trade areas around the arts organizations are less densely populated.
• While virtual participation in digital programming occurs in all markets, it contributes to the lowest percentage of total touch points in Small Markets.
-
What We've Learned

What Drives Total Community Engagement?
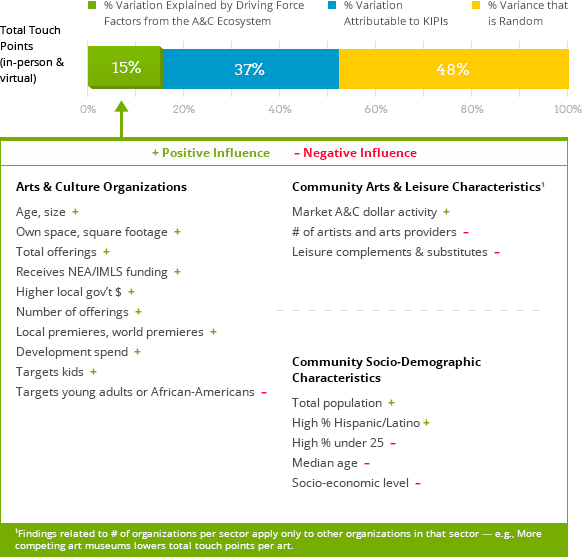
The driving force factors from the A&C Ecosystem explain 15% of community engagement, whether the touch points occurred in-person or virtually through digital programming. 37% is driven by the expertise at cultivating relationships and attracting people to become engaged with the organization, and 48% is attributable to random variation.
What Drives In-Person Engagement?
The driving force factors from the A&C Ecosystem explain 18% of in-person community engagement. That 18% can be broken down as follows: 4% is due to the influence of community and cultural policy characteristics and 14% is driven by the organization’s operating characteristics and practices. 39% is driven by the expertise at cultivating relationships and attracting people to become engaged with the organization, and 43% is attributable to random variation.


