How many months of working capital does the organization have?
-
- VIEW AVERAGES BY:
- Overall
- Arts Sector
- Size
- Geography
-

The Key Findings
Organizations had five months of working capital. This translates as working capital that is equivalent to 41.6% of total expenses, or average working capital of $871,689 relative to average expenses (before depreciation) of $2,095,474.
Working capital is a measure of the organization’s liquidity that represents its unrestricted resources available to meet day-to-day obligations. It is a simple calculation of unrestricted current assets minus unrestricted current liabilities.
Working capital lets an organization smooth out the bumps in the timing of cash coming in and cash going out to keep operations going. This liquidity allows an organization to pay its bills on time and to pay obligations such as payroll on time. Were working capital negative, it would mean that the organization is experiencing periods of cash flow crunch and borrowing funds (e.g., dipping into deferred revenue, delaying payables, taking out loans, tapping lines of credit, etc.) to meet daily operating needs.
*2,701 organizations. Includes only organizations that report sufficient balance sheet data to analyze working capital
-

Arts Education
Ave. Working Capital/
$478,004
Ave. Total Expenses (Before Depr.)
$1,421,116
*2,701 organizations represented in the graph. Includes only organizations that report sufficient balance sheet data to analyze working capital.
The Key Findings
-
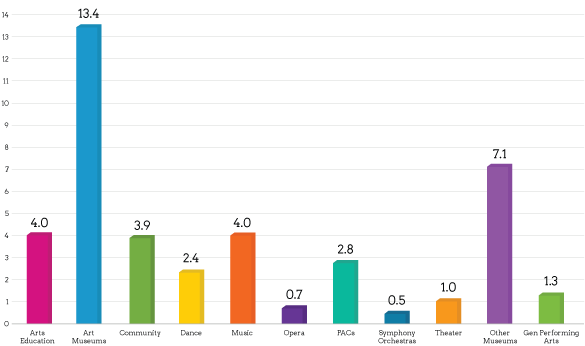
Every sector averaged positive working capital.
-
By examining results by arts sector, we see that the Overall average of 5 months of working capital is driven by Museums. All other sectors’ working capital index averaged 4 months or less.
-
Art Museums and Other Museums recorded the highest levels of working capital and among the highest levels of average expenses.
-
Orchestras and Opera companies had the lowest average months of working capital.
-
-

Small Organization
Ave. Working Capital/
$120,977
Ave. Total Expenses (Before Depr.)
$191,751
*2,701 organizations represented in the graph. Includes only organizations that report sufficient balance sheet data to analyze working capital.
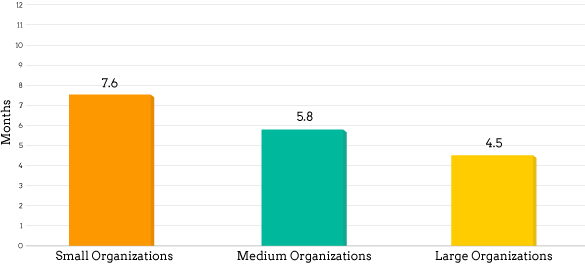
The Key Findings by Size
To appreciate working capital levels for organizations of different size, it helps to understand what’s going on with its component parts (not shown in the chart).
-
The starting point: Unrestricted Current Assets. Both Small (those that reported detail on assets by restriction) and Medium organizations’ level of unrestricted current assets was equivalent to roughly 72% of total expenses, whereas that of Large organizations was 63%.
-
Layer in Unrestricted Current Liabilities. As organizations increased in size, their unrestricted current liabilities increased in proportion to their unrestricted current assets. Small organizations’ unrestricted current assets averaged 9 times the level of their unrestricted current liabilities. For Medium organizations that figure dropped to 5, and for Large organizations 3. Large organizations’ relative level of unrestricted current liabilities limited their working capital.
-
A balance sheet side note. On average, only Large organizations had access to readily available cash and investments that exceeded the amount captured as unrestricted current assets. This measure includes unrestricted and temporarily restricted cash, cash equivalents, investments, and line of credit limit. Large organizations that have a long planning horizon or plan multi-year projects depend on the release of previously raised, multi-year money sitting in temporarily restricted cash. We know from the NCAR Fundraising Report that as organizations grow in budget size, the release of temporarily restricted net assets into the current year -- a clear sign of multi-year planning – becomes an increasingly important part of the year’s contributed revenue. Galvanizing donors behind a big idea that will occur in the future appears to be a hallmark of growth.
** Working capital is calculated as unrestricted current assets less unrestricted current liabilities when organizations report their assets by category of restriction, which is most often the case for Medium and Large organizations that operate independently and have a balance sheet. Many Small organizations, however, do not have this level of detail at their disposal when they report their data. So, to be as inclusive as possible, for Small organizations we take a different approach to the calculation: Unrestricted net assets less net fixed assets less long-term investments. Since few Small organizations have restricted long-term investments, this approach gives us a fairly comparable view of their liquid net assets.
-
-


New York Los Angeles Chicago San Francisco Washington DC Large Medium Small Very Small Months of Working Capital 8.4% 3.7% 9.3% 4.7% 4.5% 4.1% 3.3% 2.0% 4.0% Working Capital/Total Expenses (before depr.) 69.7% 30.9% 77.9% 39.3% 37.3% 34.2% 27.8% 16.9% 33.7% Ave. Working Capital/ $2,350,209 $672,987 $2,274,671 $1,240,296 $1,247,642 $715,568 $656,545 $227,368 $306,377 Ave. Total Expenses (before depreciation) $3,371,329 $2,176,601 $2,921,623 $3,153,188 $3,341,349 $2,094,513 $2,357,790 $1,348,202 $908,099 Key Findings
- Among individual markets, New York had substantially higher months of working capital. This high level isn’t attributable to one or two outliers. At $3.1 million, New York organizations’ average unrestricted current assets are more than 50% higher than those of the next highest market, DC, while their unrestricted current liabilities are only 5% higher (not shown in the table).
- The high averages for Chicago are driven by one outlier. Eliminating this organization from the analyses would leave Chicago averages much closer in line with most other markets: an average of 3.6 months of working capital, average working capital of $601,275 and average expenses of $2,008,289.
- Organizations in the San Francisco and DC areas had virtually the same number of months of working capital and nearly identical average working capital and expenses.
- Organizations in Large, Medium and Very Small markets and those in the L.A. area tended to have relatively equal levels of liquidity, while Small markets averaged significantly fewer months of working capital. Compared to Very Small markets, organizations in Small markets tended to have lower average levels of working capital coupled with higher expenses.
-
What We've Learned

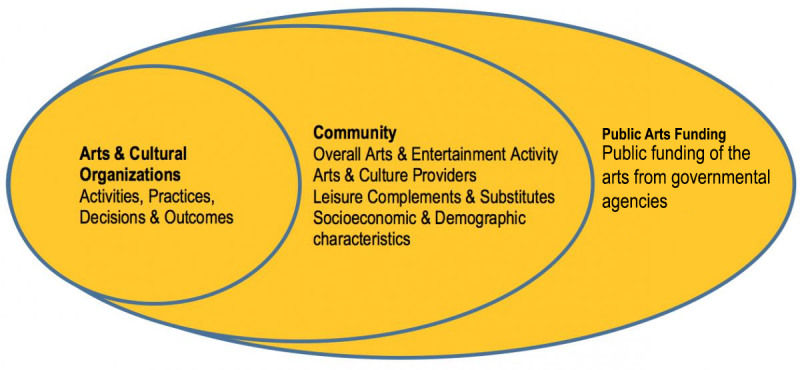
Working capital is a formula created by subtracting unrestricted current liabilities from unrestricted current assets. To understand the difference between the two, we look at what drives each of the component parts.
Unrestricted Current Assets
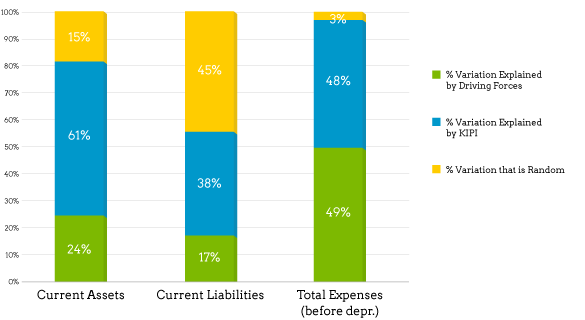
24% of the variation in total unrestricted current assets is explained by the factors from the A&C Ecosystem. That 24% can be broken down as follows: 4% is due to the influence of community characteristics and 20% is driven by the organization’s operating characteristics and practices. Nearly three quarters is attributable to expertise in establishing and managing the level of current assets and 3% of variation in total expenses is random.
Unrestricted Current Liabilities
17% of the variation in total unrestricted current liabilities is explained by the factors from the A&C Ecosystem. That 17% can be broken down as follows: 4% is due to the influence of community characteristics and 13% is driven by the organization’s operating characteristics and practices. Another 61% is attributable to expertise in establishing and managing the level of current liabilities and 4% of variation in total expenses is random.
Total Expenses (before depreciation)
49% of the variation in total expenses (before depreciation) is explained by the factors from the A&C Ecosystem. That 49% can be broken down as follows: 6% is due to the influence of community and cultural policy characteristics and 37% is driven by the organization’s practices and operating characteristics. Another 55% is attributable to expertise in establishing and managing the level of total expenses. Only 2% of variation in total expenses is random.See the Factors that Drive Performance


