What’s Behind the Bottom Line?

Guest post by Kate Barr, President & CEO, Propel Nonprofits
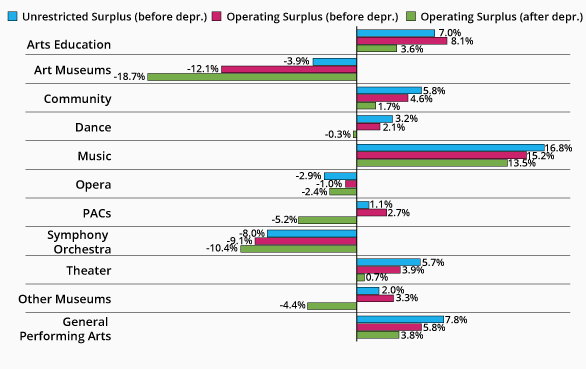
The good folks at the National Center for Arts Research just released a new Bottom Line report, which examines trends in the financial fortunes of arts organizations spanning a range of arts sectors, sizes and geographies. The report seeks to answer whether arts organizations are creating a surplus, breaking even, or losing money, then break those organizations into sector-specific categories (including arts education, art museums, dance, music, opera, symphony orchestras and theater, among others) in order to track the trends for each one. I appreciate this line of inquiry since operating surpluses are critical to long-term financial viability for nonprofits.
The report calculated the organizations’ bottom line in three different ways, but regardless of how you slice it, the overall findings showed sharp downward trends. The most revealing calculation of the three is probably Operating Surplus After Depreciation, which takes into account the ongoing costs of maintaining physical infrastructure (such as buildings) for many larger organizations. According to the report, “The average organizations bottom line deteriorated from an operating surplus equivalent to 2% of budget [in 2013] to an operating deficit of -6% [in 2016], accounting for depreciation.” If you know us at Propel Nonprofits, you’ve probably heard us implore nonprofits to consider the importance of depreciation.
Across the arts, the sectors that took the biggest hit include art museums, orchestras and operas. In the classic view of the arts ecosystem, those categories represent the institutions—traditional, older organizations with fixed costs and fixed addresses. Other sectors, including community arts programs, theater, arts education and general performing arts, are doing OK. And when you parse the data based on size, it’s small organizations that are doing the best.
I think there’s a reason for that. One of the realities of being a small arts nonprofit is that you don’t have the option of going into the red. You simply can’t lose money year after year; you’ll go out of business. This mandates a continual nimbleness and adaptability. If you have a bad year of fundraising, you adjust right away and scale down.
Small organizations are like an accordion that can shrink and grow with relative agility. Medium organizations are like a drum kit—more complexity and moving parts and pieces, but you can still do some dismantling and rearranging if need be. Big organizations are pipe organs; if you want to take that baby apart you’re going to have to deconstruct the whole building.
Of all these business models, this data shows that it’s the accordion that’s the most sustainable. The necessary adaptability these organizations maintain helps keep them relatively financially healthy. They may not have deep pockets of capital, but they’re not losing. I’d also like us to recognize and celebrate the management and leadership that these organizations demonstrate with the results in this report.
Art museums and symphony orchestras in particular have an outsized number of fixed costs, and this is a painful time for them. Baumol’s cost disease (which describes the rise of salaries in jobs that have experienced no increase of labor productivity) also plays a role. While sectors such as manufacturing have seen huge growth in productivity and efficiency, string quartets can’t get more efficient. They’ll always require four (hopefully fairly paid, highly skilled) people. A theater company can program a season of one-person shows, but a symphony orchestra has to hire the number of people required to perform a symphony. If tickets don’t sell, they still have dozens of musicians on union contracts to pay.
Symphonies, museums and operas also have a long lead time for planning. Museums are working on shows right now that they’ll put on in five years, and symphony orchestras regularly plan two to three years out. All these things inhibit the ability to squeeze like an accordion in response to fluctuations in revenue.
Smaller organizations are better able to adapt and manage expenses to match revenue, but larger organizations have to try to match their revenue to their fixed expenses. An organization simply doesn’t have control over certain aspects of revenue generation, or their planning lead time is too long to be responsive.
All this is leading to new initiatives at arts institutions. Museums are trying to change their programming to foster stronger relationships with their communities, and there’s a lot of investment in new program development. Just this month, the Metropolitan Museum of Art announced a plan to charge out-of-state visitors a $25 admission fee in an effort to increase revenue. We’ll probably see more experimentation in this vein across larger arts organizations, but in the meantime, most have the capital, cash reserves and endowments to weather some losses.
The bottom line of the Bottom Line report is that larger arts organizations are going to have to change and find different revenue streams because it’s hard to manage expenses much more than they already do (unless you transition from a full symphony to a chamber orchestra). The report also demonstrates that small arts nonprofits are making it work.
Just as big corporations are studying startup culture for lessons on nimbleness and innovation, perhaps it’s time for the big arts institutions to take a page from the small nonprofit playbook and learn how to play the accordion.
>>> Watch the related webinar from Monday, February 5, 2018.
###
Propel Nonprofits was created from the merger of Nonprofits Assistance Fund and MAP for Nonprofits. The two organizations’ programs were complementary, so the combination provides a more holistic approach to services that meet a larger set of nonprofits’ needs, including the ability to more closely link strategy, governance, and finance and to support nonprofits throughout their organizational lifecycle. Propel Nonprofits serves nonprofit organizations in Minnesota and the adjacent states of Wisconsin, Iowa, North Dakota, and South Dakota.