Using Data to Inform Decision-making: A look at the SMU National Center for Arts Research

This article is a cross-post with Arts Management Network
Arts organizations fall on a spectrum with regard to their relationships with data. While some collect and analyze their own data to make more informed decisions others misapply, misinterpret and may even ignore data altogether. Sheetal Singh, in her post, Making Data an Afterthought, makes the case that for some organizations, especially small ones that are operating in constant crisis mode, even thinking about data is a luxury. So it follows, that if we are not thinking about it, data becomes an afterthought.
The National Center for Arts Research’s vision is to act as a catalyst for the transformation and sustainability of the national arts and cultural community in the U.S. by being the leading provider of evidence-based insights that enable arts and cultural leaders to overcome challenges and increase impact.
In essence, we are working to provide the field with evidence-based knowledge that will move data from being an afterthought to its rightful place as a tool that can be used strategically in making managerial decisions. It isn’t about data for the sake of data, it’s about the end-goal of healthier organizations that have stable and expanded resources to dedicate to pursuit of mission and engagement of the community. Many arts organizations already have data on their hands but they may not be thinking of it as such. Information such as patron name, email address, age, and mailing address are often collected at the box office and are great places to find data that might already be readily available.
There is no one size fits all performance measure. Instead, metrics for organizational health are as varied as the field itself. In consultation with industry leaders across the United States, NCAR has identified 184 ways (!) that people measure the health of their organizations. In our NCAR reports we focus on a subset of 27, which fall into 9 general areas:
- Contributed revenue
- Earned revenue
- Expenses
- Marketing impact
- Bottom line
- Balance sheet
- Community engagement
- Program activity and
- Staffing
These measures – or ‘indices’ – provide a menu that allows people to hone in on areas that interest them most.
It is important to note that our findings are not prescriptive. We do not recommend an ideal set point for any of our measures. Scoring high when benchmarking may indicate that you are achieving your objectives, or you may WANT a low score on some measures given organizational priorities.
In addition to providing insights on the factors that drive performance, NCAR reports on overall average performance as well as by sector, organizational size, and geography. Take for example our program revenue per attendee metric, defined as revenue from ALL activity earned by the organization in return for its provision of mission-related products or services that generate attendance or engage people as participants. In other words, all ticket sales revenue plus all revenue an organization earned because someone walked through its doors are included in this calculation. Think gift shop and concession sales, tuition for classes offered, parking fees, etc. ALL ARE INCLUDED.
Our findings demonstrate that Community organizations reported the lowest average program revenue per attendee at $5.69.
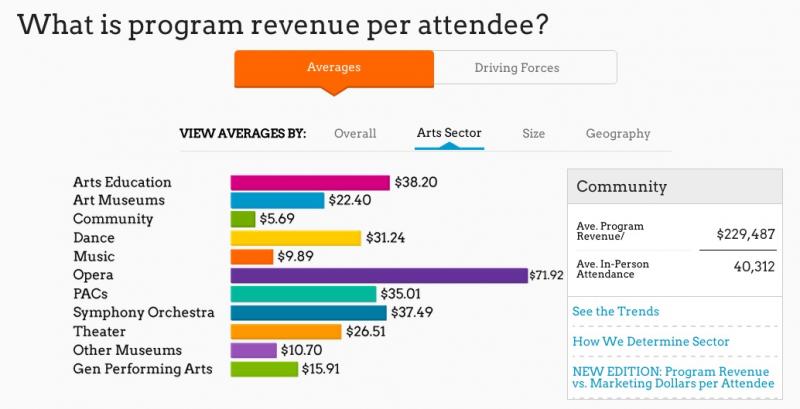
This finding may be reflective of mission-based practices such that Community organizations offer most of their programming free of charge or for a nominal fee. The important thing in this situation is to know where your organization stands so you can assess whether you are where you want to be.
When looking at your own organization, it may be helpful to see how others in the field are thinking about these issues. One suggestion is to review the benchmarks that NCAR explores to stimulate thinking regarding your own organization’s performance. We provide basic ways to benchmark performance for line items you may already have, including ways to calculate the figures you are exploring. For each of the questions we pose, we’ve included a Methodology section that provides a description of the numerator and denominator as well as the formula used in the calculation.
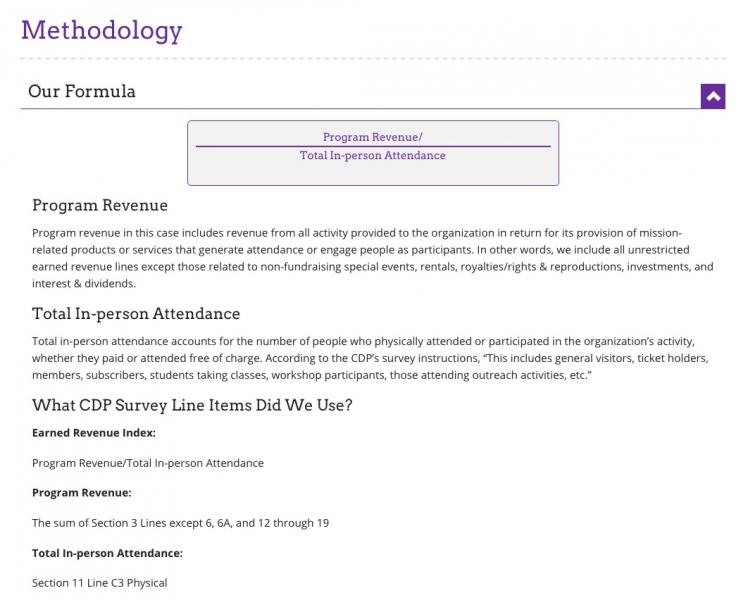
For our U.S. based art leaders, we’ve also included the survey line items used by the Cultural Data Project—Data Arts that may assist you in your own calculations. We understand that some organizations may not have the capacity and resources to run a variety of these measures for themselves. We suggest that you choose a few that are important to your organization and start there.
The NCAR reports are provided as a service to the field, FREE OF CHARGE and can be found on our website at http://mcs.smu.edu/artsresearch/. To date, we have released three reports that explore the state of the arts in the United States. Released September 2015, the Third Edition marks a shift in our reporting structure to release findings from new sets of data by focusing on particular content areas every four months. We would love to hear from you! Please let us know what areas are of interest to you and/or areas that you would like for us to explore in future reports. In the meantime, our hope is that you will use data to shed light on your organization’s performance and let it inform your decision-making.