4. What Drives Performance
What Drives Performance?
There are many ways to consider performance. There’s reporting on AVERAGE, examining what drives performance from the Arts & Cultural Ecosystem and beyond, and probing the notion of what drives high performance.
Watch the "What's a KIPI? Explaining the Unexplained" video
We know from the AVERAGES section of the report editions that part of the reason that performance may be different from organization to organization is due to its sector – e.g., it is an art museum, not a symphony orchestra – and budget size. So, an organization’s sector and its size partly explain why performance differs or varies from that of other organizations. Each element of the Ecosystem should be considered as a potential factor that impacts performance. Combined, the elements explain variations in performance to some extent. The higher the variation explained, the better job the predictors are doing at actually explaining performance. But the elements of the Ecosystem do not explain everything about why one organization performs differently than another.
There are 3 influences on each performance measure: 1) the influence of easy-to-observe-and measure factors from the Arts & Culture Ecosystem, like sector and size, which combine to explain some amount of variation in performance; 2) the influence of intangible, difficult-to-observe-and-measure characteristics like good decision-making, artistic and managerial expertise, reputation and relationships, intellectual capital, and the quality of the work force that affect an organization’s performance, which we call KIPIs (Key Intangible Performance Indicators); and (3) some level of random variation.
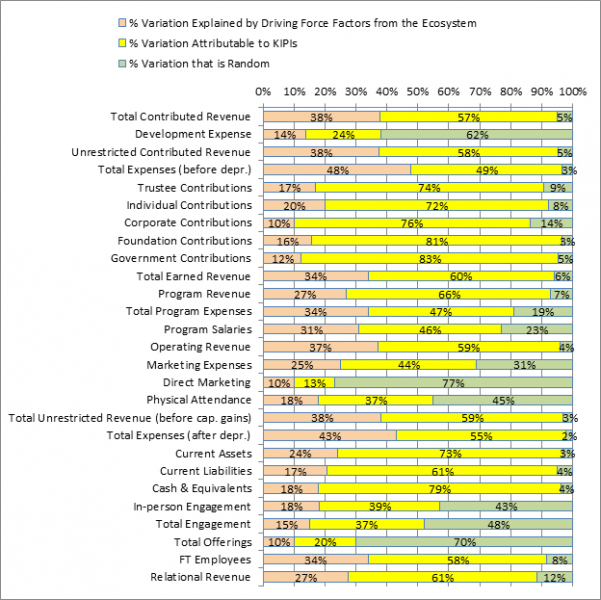
As shown in the Table below and detailed in the DRIVING FORCES section of the report editions, the amount of variation explained by the driving force factors ranged 10% for Total Offerings and Direct Marketing Expenses to 48% for Total Expenses. So our first takeaway is that there is substantial variation in our ability to predict different outcomes. By extension, we better understand the factors driving organizations’ Total Expenses than we understand how effective arts and culture organizations are in making decisions about how much programming to offer and the right amount of marketing expenses to budget. Likewise, we better understand the factors driving Total Operating Revenue (37%) than we understand what affects support from Corporations (10%). When the KIPI is high, it implies that there exists a significant store of intellectual capital that is driving the difference between low-performing and high-performing arts and cultural organizations with respect to these revenue measures.
We see differences in the KIPI numbers for Program Revenue and Marketing Expenses. Although both are similarly explained by organizational, community, and cultural policy factors, the KIPI is much greater for Program Revenue (66%) than it is for Marketing Expenses (44%), which includes staff and non-staff marketing expenses. These numbers imply that organizations possess greater intangible skill with respect to generating Program Revenue than for making Marketing Expense allocations. Although we can’t unambiguously attribute these differences to specific causes, there are several reasonable explanations for the pattern of results. The causes manifest somewhat differently, but they all come back to expertise in decision-making.
Explained Variation and Unexplained Variation Attributable to KIPI and Random Variation

Program Revenues are easily quantified and frequently form the basis for organizational objectives. This focus intensifies evaluation of past successes and failures and encourages greater consideration of strategic changes that could improve future performance. In other words, organizational learning occurs. The result is low levels of random variation and high levels of intellectual capital. Marketing Expense allocations may attract somewhat less attention and focus in terms of organizational objectives, leading to higher levels of random variation and lower levels of intellectual capital developed by organizations.
A second explanation is measurement, which ties back to managerial attention because we tend to focus on accurately tracking and measuring outcomes that matter most to us. The greater the error in measurement – i.e., sloppy or inconsistent reporting – the greater is the proportion of unexplained variance that will ultimately end up in the random error component. Inconsistent measurement across organizations in terms of what constitutes a marketing expense versus program, development, education or volunteer expense may be a partial cause.
With respect to attention and objectives, how many arts organizations view marketing as an integral part of organizational success? At the executive level, do they allocate resources and effort to careful analysis of what marketing resources are necessary given revenue objectives or return on marketing? Or do they allocate a fixed amount or fixed percentage to marketing efforts each year or for each event, assuming that marketing will need the same resources for the same direct mail campaigns, list swaps, and occasional newspaper ad that they have always implemented? The relatively low Marketing Expense KIPI suggests that less attention is paid to marketing budget allocations overall, and the KIPI becomes even smaller if we focus only on the subset of non-staff Direct Marketing Expenses.
We can dig even deeper to better understand how much the different factors from the ecosystem affect performance. Here we compare all of the elements that explain variation in Total Operating Revenue and Total In-person Attendance.
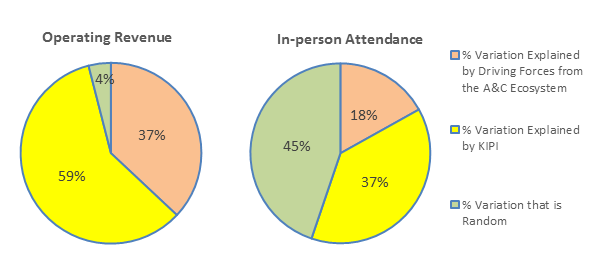

We know that 37% of variation in Operating Revenue is explained by the easy-to-observe and measure factors from the Ecosystem. The KIPI explains 59%, and 4% is random. By contrast, the Ecosystem elements explain 18% of In-person Attendance. The KIPI explains 37% and 45% is random. This means that intangible expertise is the single-most important determinant of Operating Revenue, far more important than community characteristics or even the observable organizational characteristics.
We are just beginning to understand the complex factors that influence performance. We know that the relative influence of the various drivers reported on here will vary somewhat by arts and cultural sector and by organizational size. We will explore these differences in more depth in future reports.
What Drives Performance from the Arts & Culture Ecosystem?
To consider what drives the performance of arts and cultural organizations[1], we return to the concept of the Arts and Culture Ecosystem and its elements: arts and cultural organizations, the community, and Public Funding. This means that characteristics of each element of the Ecosystem should be considered as a potential factor that impacts performance. These represent relatively easy-to-observe-and-measure determinants of organizational performance.
Each performance index reports on a relationship. We unpack each performance index into its relationship components – a numerator and denominator. For each numerator and denominator, we then identify likely organizational, community, and policy variables that act as predictors. In the following sections, we highlight the more interesting findings in three categories (for a complete summary of results, see hyperlink):
- What organizational characteristics affect this performance?
- How do community characteristics affect performance? We further divide these effects into arts and leisure characteristics (entities which act as competitors, complements or substitutes[2]), and socio-demographic characteristics.
- What impact does Public Funding have on performance?
There tends to be strong correlations among the various community characteristics. For example, income and educational attainment are highly correlated and the number of restaurants and hotels in a community are also highly correlated. Strong correlations make it difficult to tell which individual characteristic is really driving the effect, so we combined highly correlated measures using a technique called factor analysis. This produced four Community factors:
- Total Arts Dollars captures the total dollar value of arts activity in a community; it is a composite measure of (a) program revenue, (b) contributed revenue, (c) total expenses, and (d) total assets for all arts organizations in the community.
- Total Number of Arts Providers captures the number of arts and culture organizations, their employees, and independent artists in the community; it is a composite measure that includes (a) a broad measure of the number of arts and entertainment organizations, (b) a more focused measure of the number of arts organizations, (c) number of employees at arts and entertainment organizations, and (d) number of independent artists.
- Leisure Complements and Substitutes2 capture the number and concentration of leisure venues in the community; it is a composite measure of the number of: (a) restaurants, (b) hotels, (c) cinemas, (d) zoos, and (e) sports teams.
- Socio-economic Level captures underlying income and education characteristics of the community; it is a composite measure of: (a) per capita income, (b) percent of the population gainfully employed, (c) percentage of households with over $200K in annual income, and (d) percentage of people with a graduate degree.
In addition, we look at the impact of the total dollar activity of public radio and television stations in the local market. Other demographic characteristics include total population and three measures of community age (median age and percentage of the population under 18 and 18-24) and racial diversity (percentage of the population that self-identifies as African American, Hispanic/Latino, and Asian).
The factor analysis described above also produced a measure of Government Grant Activity, which captures the number and dollar value of state and federal grants to arts organizations in the community. This composite measure of Public Funding contains: (a) number of federal grants to arts organizations, (b) dollar value of federal grants to arts organizations, (c) number of state arts agency grants, and (d) dollar value of state arts agency grants. It is important to keep in mind that we look at the total government grant activity in the market as a measure of Public Funding; we also look at grant activity for each organization, which is one of the organizational characteristics we examine.
Some of our findings confirm what you’d expect – i.e., they predict what you’d expect them to predict. Other findings were somewhat surprising and deserve more discussion and further exploration. Some predictors have the same effect regardless of the performance measure in question; others demonstrate patterns that hint at complex dynamics.
What Drives Performance from the Arts & Culture Ecosystem, by Ecosystem Category
Organizational Highlights
Performance outcomes vary by arts and cultural sector. Organizational size (total expenses) leads to higher outcomes in nearly every case. Other organizational characteristics were not included in every analysis but yielded consistently positive effects each time they were included; for example, being in the midst of a capital campaign (+), receiving NEA or IMLS funding (+), total investments (+), number of board members (+), level of fixed assets (+), higher ticket price (+), number of members(+), number of employees (+), number of programmatic offerings (+), higher fundraising expenditures (+),and higher attendance (+).
Other decisions and activities exerted intriguing patterns of results. For example:
- Higher ticket prices increased both income from subscribers and members as well as contributions from trustees but decreased government contributions and physical attendance (a high low ticket price). They were also linked with higher program expenses, and a higher spend on marketing.
- The number of local premieres had varying effects depending on the arts and culture sector. For example, theatres that produced more local premieres had higher trustee, individual, and corporate support but lower government funding. By contrast, art museums with a higher propensity for local premieres tend to spend more on programs, earn less program revenue, and have lower trustee, foundation, and government support.
- World and national premieres also had varying effects on outcomes depending on the arts and cultural sector. For example, dance companies that offer proportionally more world and national premieres tend to have smaller budgets but higher funding from trustees, individuals, corporations, foundations, and government. By contrast, symphony orchestras that offer more world or national premiere tend to have a larger staff, spend less on program, and have higher government and foundation support. Both sectors reported lower attendance and in-person engagement; however, orchestras the offer more world premieres have higher total engagement, meaning that they are engaging people with new works through digital distribution.
- Older organizations tend to have lower contributed revenue, driven by lower trustee, individual, corporate and foundation support. Fundraising expenses tend to be lower for older organizations while total expenses and government support tend to be higher.
- Organizations that target African-Americans attract lower levels of unrestricted contributed funds but tend to have a smaller footprint, with fewer offerings, lower marketing and development expenses, less income from members/subscribers, and lower program revenue, attendance, and engagement. They tend towards higher program expenses and more full-time employees as well as higher individual, corporate, foundation and government support, all else considered.
- Organizations that target Hispanics/Latinos have higher unrestricted contributed revenue (higher corporate, government and foundation support), program and fundraising salaries, income from members/subscribers and total offerings but lower marketing expenses, trustee and individual contributions, and program and earned revenue.
- Organizations that primarily serve Asian Americans tend to spend less on program personnel but more on total program expenses, attract less support from trustees and foundations but more from government agencies, and they have higher levels of attendance, community engagement and program revenue.
- And organizations targeting children have lower marketing expenses that yield higher attendance, engagement and earned revenue, and higher development expenses that yield lower unrestricted contributions. This puzzling finding seems to suggest that parent-contributors have a short-term focus on immediate benefits for their children without necessarily supporting the long-term financial health of the organization.
Community Highlights
Several community characteristics have net positive – although not consistently positive – effects for all performance measures.
- Total Arts Dollars in the community tends to drive up the number of total offerings, staff size, programming expenditures, total budget size, program revenue, trustee and individual contributions, and foundation support. However more Arts Dollars in the community tends to lead organizations to spend less on marketing, attract fewer attendees and less corporate and government support. Total contributed revenue is higher but unrestricted contributed revenue is lower, indicating a high proportion of restricted donations.
- When there are more artists and Arts Providers in the community, organizations tend to have smaller budgets. Program salaries and total program expenses tend to be higher while development expenses, staff size, and attendance and engagement tend to be lower. A high number of Arts Providers positively impacts from every source; the impact on both program and total earned revenue is negative. This suggests competition for audiences; however, when there are more Arts Providers, organizations tend to spend less on marketing, which is a bit perplexing given the attendance and earned revenue results.
- Leisure activities act as Complements leading to increases in every performance outcome except marketing expenses and program revenue, where the effect is negative (i.e., the more leisure activities, the lower marketing expenses and program revenue). This suggest that, in communities with more alternative leisure activities, a lower spend on marketing results in more people attending but at a lower price point.
- Socio-economic level has a positive impact on budget size, the number of programmatic offerings, and the amount spent on programs. Higher socio-economic level negatively affects corporate giving and government and foundation grants, but it boosts giving from trustees and other individuals, producing an overall positive effect on total unrestricted contributions.
- Higher socio-economic level is negatively associated with physical attendance and engagement, likely reflecting increased access to other leisure opportunities like travel. Where socio-economic level is high, program and earned revenue tend to be high despite lower attendance and a lower marketing spend, reflecting the ability of arts organizations to charge higher prices.
- Population is a positive driver of nearly every performance measure. The exceptions are the amount spent on program personnel and fundraising, contributions from individuals, and government support, where population density has a negative effect.
- Level of Philanthropy in the community is a positive driver of corporate support, the only philanthropic source showing a significant effect. Interestingly, locating in a community that has a higher propensity for philanthropy results in lower overall program revenue but higher attendance. It may be that the higher level of corporate support is earmarked to underwrite lower admission prices.
- Higher Public Broadcast Dollar Activity in the market tended to drive up program expenditures as well as corporate and government support and membership and subscription revenue. It had a negative influence on the number of programmatic offerings, development expenditures, attendance and engagement, as well as trustee and other individual giving.
Public Funding Highlights
The pattern of results for Government Grant Activity in the market is also interesting. For example:
- Government Grant Activity has a positive effect on fulltime employees but a negative effect on the number of offerings and the amount spent on fundraising.
- Government Grant Activity in the market has a positive effect on an organization’s contributions from trustees, individuals and government but a negative influence on foundation funding creating a net positive effect on total contributed revenue.
- And Government Grant Activity has a negative effect on earned revenue and a negative effect on physical attendance and engagement; these negative effects may reflect government support for arts and culture organizations that are initiating outreach efforts targeting traditionally underserved populations.
What Drives Performance from the Arts & Culture Ecosystem, by Index
Return on Fundraising Index
What Drives Total Contributions?
38% of the variation in the level of total contributed revenue is explained by the factors from the A&C Ecosystem. Over half – 57% -- is attributable to fundraising expertise, and 5% of variation in the amount of unrestricted contributions raised is random.
What Drives Total Fundraising Expenses (including personnel)?
14% of the variation in fundraising expenses is explained by the factors from the A&C Ecosystem. Another 25% is attributable to expertise in establishing and managing the level of total expenses. Nearly two-thirds of variation in fundraising expenses is random.


For a listing of What Drives Performance from the A&C Ecosystem, see the Index-Specific Drivers for this Index.
What Drives Total Contributed Revenue?
What organizational characteristics affect this performance?
We take into account each organization’s level of unrestricted contributed revenue as a starting place for examining the effects of various factors on total contributed revenue. Doing so focuses the effects of the driving forces on those elements that drive a difference between unrestricted versus total contributed revenue – i.e., temporarily and permanently restricted revenue.
- Total contributions increase for organizations in a capital campaign and those awarded NEA or IMLS grants.
- When organizations target kids, total contributed revenue tends to be lower. Total contributed revenue also tends to decrease with organizational age.
How do community arts and leisure characteristics affect performance?
- Total contributed revenue tends to be higher for organizations in communities with more leisure activities, which in this case act as complements.
- Having more arts education organizations and art museums in a community tends to raise the total contributed revenue tide for all organizations in these sectors in a market, while having more other museums tends to lower the total contributed revenue for all organizations in this sector.
- More public broadcast activity in a market tends to drive down arts and cultural organizations’ total contributed revenue.
How do socio-demographic characteristics of the community affect performance?
- Total contributed revenue is higher for organizations in communities where the percentage of the population that is under 25, Asian American or African American is higher. This is also the case where the population’s median age is higher.
- As the level of individual philanthropy in the market increases, total contributed revenue goes down. The fact that there is more giving in a market does not necessarily mean that it is being directed to arts and cultural organizations.
What impact does Public Funding have on performance?
- Overall state and federal grant activity in the larger local marketplace has a positive effect on an individual organization’s total contributed revenue.
What Drives Total Fundraising Expenses, including personnel?
What organizational characteristics affect this performance?
- Fundraising expenses increase with sector, organizational age, budget size, a larger board, a higher level of fixed assets and more paid fundraising staff members. Fundraising expenses also tend to be relatively higher for organizations that target people under 25 or Hispanics/Latinos.
- When organizations are older or they target African Americans, fundraising expense levels tend to be lower. The same is true for organizations that have a parent organization.
How do community arts and leisure characteristics affect performance?
- Fundraising expenses tend to be higher for organizations in communities with higher levels of total arts dollar activity and more leisure activities, which in this case act as complements. Having more dance companies, orchestras, theatre companies, music and general performing arts organizations in a community tends to raise the spend on fundraising for all organizations in these sectors in the market.
- The more arts education organizations and opera companies competing in market drives down the fundraising spend for all organizations in these sectors. In other words, more intense competition leads organizations in these sectors to spend less on fundraising.
- More public broadcast activity in a market tends to drive down arts and cultural organizations’ fundraising expense levels, as does the presence of more artists and arts providers in the community.
How do socio-demographic characteristics of the community affect performance?
- Fundraising expenses are higher for organizations in less densely populated communities, more philanthropic communities, and where the percentage of the population that is under 25 or Asian American is higher.
What impact does Public Funding have on performance?
- Where there is higher overall state and federal grant activity in the local marketplace, organizations tend to spend less on fundraising expenses.
Unrestricted Contributions Index
What Drives Unrestricted Contributed Revenue?
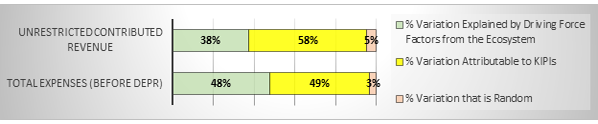
More than a third of the variation in the level of unrestricted contributed revenue is explained by the factors from the A&C Ecosystem. Another 58% is attributable to fundraising expertise, and 5% of variation in the amount of unrestricted contributions raised is random.
What Drives Total Expenses (before depreciation)?
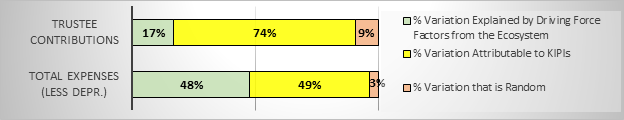
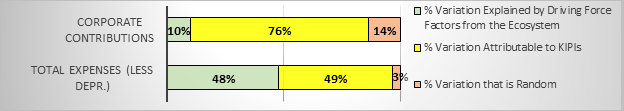
48% of the variation in total expenses (before depreciation) is explained by the factors from the A&C Ecosystem. Another 49% is attributable to expertise in establishing and managing the level of total expenses. Only 3% of variation in total expenses is random.

For a listing of What Drives Performance from the A&C Ecosystem, see the Index-Specific Drivers for this Index?
What Drives Unrestricted Contributed Revenue?
What organizational characteristics affect this performance?
- Unrestricted contributions increase with budget size for organizations in each sector. Unrestricted contributed revenue is higher for organizations that have a parent/sheltering organization or are in the midst of a capital campaign.
- When organizations target kids, African Americans or Asian Americans, unrestricted contributed revenue tends to be lower.
How do community arts and leisure characteristics affect performance?
- Unrestricted contributed revenue tends to be higher for organizations in communities with higher levels of total number of artists and arts providers, but lower for organizations in communities with higher levels of total arts dollar activity.
- With the exception of arts education organizations, dance and opera companies, having more organizations that compete in each arts and cultural sector drives down unrestricted contributed revenue for all organizations in the sector. This is also the case when there is more public broadcast activity.
How do socio-demographic characteristics of the community affect performance?
- Unrestricted contributed revenue is higher in communities with higher socioeconomic levels, and where the percentage of the population that is 18-25, Hispanic/Latino or African American is higher.
- As the socioeconomic level increases unrestricted contributed revenue goes down.
What impact does Public Funding have on performance?
- Overall state and federal grant activity in the larger local marketplace has a positive on an individual organization’s unrestricted contributed revenue.
What Drives Total Expenses (before depreciation)?
What organizational characteristics affect this performance?
- Expenses increase with sector, organizational age, budget size, higher levels of local and state funding, and more programmatic offerings. Expenses also tend to be relatively higher for organizations target that young adults or Asian Americans.
- When organizations have a parent organization, primarily serve kids or African Americans, or offer a higher level of local or world premieres, expenses tend to be lower.
How do community arts and leisure characteristics affect performance?
- Expenses tend to be higher for organizations in communities with higher levels of total arts dollar activity and more leisure activities, which in this case act as complements.
- Having more organizations in the arts education, PAC, orchestra, and general performing arts sectors tends to increase budget size for all organizations in those sectors.
- Organizations tend to have lower expense levels when there is a high number of arts providers and artists in the community.
- Having more organizations that compete in the art museum and music sectors drives down expenses for all organizations in these sectors. In other words, the competition makes it more difficult for organizations in these sectors to grow in budget size.
How do socio-demographic characteristics of the community affect performance?
- Total expenses are higher for organizations in more densely populated communities and communities with a higher median age in the population, those with a higher socioeconomic level, and where the percentage of the population that is under 25, Hispanic/Latino, or Asian American is higher.
What impact does Public Funding have on performance?
- Higher overall state and federal grant activity in the local marketplace has no effect on total expenses.
Trustee Contribution Index
What Drives Unrestricted Trustee Contributions?
The driving force factors from the A&C Ecosystem explain 17% of unrestricted trustee contribution performance. Nearly three-quarters – 74% -- of the variation in trustee contributions is attributable to intangibles such as strong bonds between board members and staff leadership, and 9% of variation in the amount of unrestricted contributions raised is random.
What Drives Total Expenses (before depreciation)?
48% of the variation in total expenses (before depreciation) is explained by the factors from the A&C Ecosystem. Another 49% is attributable to expertise in establishing and managing the level of total expenses. Only 3% of variation in total expenses is random.

For a listing of What Drives Performance from the A&C Ecosystem, see the Index-Specific Drivers for this Index?
What Drives Unrestricted Trustee Revenue?
What organizational characteristics affect this performance?
- Unrestricted contributions from trustees increase with sector, budget size, level of fixed assets and investment income, and having more square footage. Trustee contributions are also higher for organizations that are in the midst of a capital campaign or recently completed one, have higher ticket prices, do more world premieres, and those that are awarded NEA or IMLS grants.
- Trustee contributions tend to be lower if an organization has a parent organization, or if it targets young adults, Asian Americans, African Americans or Hispanics/Latinos. Trustee contribution levels also tend to decrease as organizational age increases.
How do community arts and leisure characteristics affect performance?
- Trustee giving tends to be higher for organizations in communities with higher levels of total arts dollar activity and total number of artists and arts providers. Having more community-based organizations, “other” museums, or orchestras in a community tends to raise the tide of trustee contributions for all organizations in those sectors in the market.
- Having more organizations that compete in the art museum, opera, and general performing arts sectors drives down trustee contributions for all organizations in these sectors. This is also the case when there is more public broadcast activity.
How do socio-demographic characteristics of the community affect performance?
- Unrestricted trustee contributions are higher for organizations in more densely populated communities, in communities where the socioeconomic level and median age of the population are higher, and where there is a higher percentage of the population that is 18-25 years of age, African American or Hispanic/Latino.
- Trustee contributions tend to be lower in communities with either a higher percentage of the population under 18 or Asian American.
What impact does Public Funding have on performance?
- Higher levels of state and federal government grant activity in the local market raise the individual unrestricted trustee contributions for organizations in that market.
What Drives Total Expenses (before depreciation)?
What organizational characteristics affect this performance?
- Expenses increase with sector, organizational age, budget size, higher levels of local and state funding, and more programmatic offerings. Expenses also tend to be relatively higher for organizations target that young adults or Asian Americans.
- When organizations have a parent organization, primarily serve kids or African Americans, or offer a higher level of local or world premieres, expenses tend to be lower.
How do community arts and leisure characteristics affect performance?
- Expenses tend to be higher for organizations in communities with higher levels of total arts dollar activity and more leisure activities, which in this case act as complements.
- Having more organizations in the arts education, PAC, orchestra, and general performing arts sectors tends to increase budget size for all organizations in those sectors.
- Organizations tend to have lower expense levels when there is a high number of arts providers and artists in the community.
- Having more organizations that compete in the art museum and music sectors drives down expenses for all organizations in these sectors. In other words, the competition makes it more difficult for organizations in these sectors to grow in budget size.
How do socio-demographic characteristics of the community affect performance?
- Total expenses are higher for organizations in more densely populated communities and communities with a higher median age in the population, those with a higher socioeconomic level, and where the percentage of the population that is under 25, Hispanic/Latino, or Asian American is higher.
What impact does Public Funding have on performance?
- Higher overall state and federal grant activity in the local marketplace has no effect on total expenses.
Individual Contribution Index
What Drives Unrestricted Individual Contributions?
20% of the variation in the level of unrestricted individual contributions is explained by the factors from the A&C Ecosystem. Nearly three-quarters – 72% -- is attributable to intangibles such as strong fundraising expertise or quality offerings that inspire support, and 8% of variation in the amount of unrestricted contributions raised is random.
What Drives Total Expenses (before depreciation)?
48% of the variation in total expenses (before depreciation) is explained by the factors from the A&C Ecosystem. Another 49% is attributable to expertise in establishing and managing the level of total expenses. Only 3% of variation in total expenses is random.


For a listing of What Drives Performance from the A&C Ecosystem, see the Index-Specific Drivers for this Index?
What Drives Unrestricted Individual Contributions?
What organizational characteristics affect this performance?
- Unrestricted contributions from individuals increase with sector, budget size, and square footage. Individual contributions are also higher for organizations that are in the midst of a capital campaign or recently completed one, charge higher ticket prices, have more members/subscribers, spend more on fundraising, do more local premieres, or target kids or African Americans.
- Individual contributions tend to be lower if an organization is older, targets young adults or Hispanics/Latinos.
How do community arts and leisure characteristics affect performance?
- Unrestricted contributed revenue from individual donors tends to be higher for organizations in communities with higher levels of total arts dollar activity, total number of artists and arts providers, and more leisure activities, which in this case act as complements. Having more dance companies in a community tends to raise the tide of individual contributions for all dance companies in the market.
- Within all sectors except dance, orchestras, and community-based organizations, having more organizations that compete for individual contributions drives down individual contribution levels for all organizations. Individual contributions are also lower when there is more public broadcast activity.
How do socio-demographic characteristics of the community affect performance?
- Individual giving is higher for organizations in less densely populated communities, in communities where the socioeconomic level and median age of the population are higher, and where there is a higher percentage of the population that is 18-25 years of age or Hispanic/Latino.
- Individual contributions tend to be lower in communities with either a higher percentage of the population under 18, Asian American or African American.
What impact does Public Funding have on performance?
- Overall state and federal grant activity in the larger local marketplace has a positive impact on an individual organization’s unrestricted individual contributions.
What Drives Total Expenses (before depreciation)?
What organizational characteristics affect this performance?
- Expenses increase with sector, organizational age, budget size, higher levels of local and state funding, and more programmatic offerings. Expenses also tend to be relatively higher for organizations target that young adults or Asian Americans.
- When organizations have a parent organization, primarily serve kids or African Americans, or offer a higher level of local or world premieres, expenses tend to be lower.
How do community arts and leisure characteristics affect performance?
- Expenses tend to be higher for organizations in communities with higher levels of total arts dollar activity and more leisure activities, which in this case act as complements.
- Having more organizations in the arts education, PAC, orchestra, and general performing arts sectors tends to increase budget size for all organizations in those sectors.
- Organizations tend to have lower expense levels when there is a high number of arts providers and artists in the community.
- Having more organizations that compete in the art museum and music sectors drives down expenses for all organizations in these sectors. In other words, the competition makes it more difficult for organizations in these sectors to grow in budget size.
How do socio-demographic characteristics of the community affect performance?
- Total expenses are higher for organizations in more densely populated communities and communities with a higher median age in the population, those with a higher socioeconomic level, and where the percentage of the population that is under 25, Hispanic/Latino, or Asian American is higher.
What impact does Public Funding have on performance?
- Higher overall state and federal grant activity in the local marketplace has no effect on total expenses.
Corporate Contribution Index
What Drives Unrestricted Corporate Contributions?
The driving force factors from the A&C Ecosystem explain 10% of the variation in the level of unrestricted corporate contributions. Over three-quarters – 76% -- is attributable to intangibles such as strong fundraising expertise or quality offerings that inspire corporate support, and 14% of variation in the amount of unrestricted contributions raised is random.
What Drives Total Expenses (before depreciation)?
48% of the variation in total expenses (before depreciation) is explained by the factors from the A&C Ecosystem. Another 49% is attributable to expertise in establishing and managing the level of total expenses. Only 3% of variation in total expenses is random.

For a listing of What Drives Performance from the A&C Ecosystem, see the Index-Specific Drivers for this Index?
What Drives Unrestricted Corporate Contributions?
What organizational characteristics affect this performance?
- Unrestricted contributions from corporations increase with sector, budget size and relatively higher fixed assets. Corporate contributions are also higher for organizations that are in the midst of a capital campaign or recently completed one, have higher attendance, spend more on fundraising, receive higher levels of local or state support, and those that are awarded NEA or IMLS grants. Corporate contribution levels tend to be higher for organizations that target kids, African Americans or Hispanics/Latinos.
- Corporate contributions tend to be lower as organizational age increases, if an organization offers more local premieres, or if the organization targets young adults.
How do community arts and leisure characteristics affect performance?
- Unrestricted contributed revenue from corporations tends to be higher for organizations in communities with lower levels of total arts dollar activity, higher total number of artists and arts providers, more public broadcast activity, and more leisure activities, which in this case act as complements.
- Having more art museums, arts education organizations, community-based organizations, “other” museums or theatre companies in a community tends to raise the tide of corporate contributions for all organizations in those sectors in the market.
- Having more organizations that compete for corporate contributions in the dance, music, symphony orchestra, or general performing arts sectors drives down corporate contribution levels for all organizations in these sectors.
How do socio-demographic characteristics of the community affect performance?
- Corporate giving rises for organizations in more densely populated communities, more philanthropic communities, and in communities where kids make up a higher percentage of the population.
- Corporate contributions tend to be lower in communities with either a higher percentage of the population aged 18-24, African American, Asian American or Hispanic/Latino. Higher socioeconomic level in the community tends to drive lower levels of corporate contributions.
What impact does Public Funding have on performance?
- Overall state and federal grant activity in the larger local marketplace has a no significant impact on an individual organization’s unrestricted corporate contributions.
What Drives Total Expenses (before depreciation)?
What organizational characteristics affect this performance?
- Expenses increase with sector, organizational age, budget size, higher levels of local and state funding, and more programmatic offerings. Expenses also tend to be relatively higher for organizations target that young adults or Asian Americans.
- When organizations have a parent organization, primarily serve kids or African Americans, or offer a higher level of local or world premieres, expenses tend to be lower.
How do community arts and leisure characteristics affect performance?
- Expenses tend to be higher for organizations in communities with higher levels of total arts dollar activity and more leisure activities, which in this case act as complements.
- Having more organizations in the arts education, PAC, orchestra, and general performing arts sectors tends to increase budget size for all organizations in those sectors.
- Organizations tend to have lower expense levels when there is a high number of arts providers and artists in the community.
- Having more organizations that compete in the art museum and music sectors drives down expenses for all organizations in these sectors. In other words, the competition makes it more difficult for organizations in these sectors to grow in budget size.
How do socio-demographic characteristics of the community affect performance?
- Total expenses are higher for organizations in more densely populated communities and communities with a higher median age in the population, those with a higher socioeconomic level, and where the percentage of the population that is under 25, Hispanic/Latino, or Asian American is higher.
What impact does Public Funding have on performance?
- Higher overall state and federal grant activity in the local marketplace has no effect on total expenses.
Foundation Support Index
What Drives Unrestricted Foundation Support?
The driving force factors from the A&C Ecosystem explain 16% of the variation in the level of unrestricted foundation support. Well over three-quarters – 80% -- is attributable to intangibles such as strong fundraising expertise and quality offerings that inspire foundation support, and 4% of variation in the amount of unrestricted contributions raised is random.
What Drives Total Expenses (before depreciation)?
48% of the variation in total expenses (before depreciation) is explained by the factors from the A&C Ecosystem. Another 49% is attributable to expertise in establishing and managing the level of total expenses. Only 3% of variation in total expenses is random.


For a listing of What Drives Performance from the A&C Ecosystem, see the Index-Specific Drivers for this Index?
What Drives Unrestricted Foundation Support?
What organizational characteristics affect this performance?
- Unrestricted foundation support increases with sector and budget size. Foundation support is also higher for organizations that recently completed or are in the midst of a capital campaign, spend more on fundraising, do more world premieres, receive higher levels of local or state support, and those that are awarded NEA or IMLS grants. Targeting kids, young adults, African Americans and Hispanics/Latinos tends to raise foundation funding levels.
- Foundation support tends to be lower as organizational age increases, as square footage increases, or if the organization targets Asian Americans. Doing more local premieres tends to drive down foundation support.
How do community arts and leisure characteristics affect performance?
- Unrestricted contributed revenue from foundations tends to be higher for organizations in communities with higher levels of total arts dollar activity, total number of artists and arts providers, and more leisure activities, which in this case act as complements.
- Having more organizations that compete for foundation support in a sector drives up foundation support levels for all organizations in the sector, with the exception of opera where more competing opera companies has no effect on foundation support.
How do socio-demographic characteristics of the community affect performance?
- Foundation support is higher for organizations in communities where the population has a higher median age.
- Foundation support tends to be lower in communities with either a higher percentage of the population 18-24 years of age, Asian American or Hispanic/Latino. Higher socioeconomic level in the community also tends to drive lower levels of foundation support.
What impact does Public Funding have on performance?
- Overall state and federal grant activity in the larger local marketplace tends to drive up an individual organization’s unrestricted foundation support.
What Drives Total Expenses (before depreciation)?
What organizational characteristics affect this performance?
- Expenses increase with sector, organizational age, budget size, higher levels of local and state funding, and more programmatic offerings. Expenses also tend to be relatively higher for organizations target that young adults or Asian Americans.
- When organizations have a parent organization, primarily serve kids or African Americans, or offer a higher level of local or world premieres, expenses tend to be lower.
How do community arts and leisure characteristics affect performance?
- Expenses tend to be higher for organizations in communities with higher levels of total arts dollar activity and more leisure activities, which in this case act as complements.
- Having more organizations in the arts education, PAC, orchestra, and general performing arts sectors tends to increase budget size for all organizations in those sectors.
- Organizations tend to have lower expense levels when there is a high number of arts providers and artists in the community.
- Having more organizations that compete in the art museum and music sectors drives down expenses for all organizations in these sectors. In other words, the competition makes it more difficult for organizations in these sectors to grow in budget size.
How do socio-demographic characteristics of the community affect performance?
- Total expenses are higher for organizations in more densely populated communities and communities with a higher median age in the population, those with a higher socioeconomic level, and where the percentage of the population that is under 25, Hispanic/Latino, or Asian American is higher.
What impact does Public Funding have on performance?
- Higher overall state and federal grant activity in the local marketplace has no effect on total expenses.
Government Support Index
What Drives Unrestricted Government Support?
The driving force factors from the A&C Ecosystem explain12% of the variation in the level of unrestricted foundation support is explained by the factors from the A&C Ecosystem. Well over three-quarters – 83% -- is attributable to intangibles such as strong grant writing and quality offerings that inspire government support, and 5% of variation in the amount of unrestricted contributions raised is random.
What Drives Total Expenses (before depreciation)?
48% of the variation in total expenses (before depreciation) is explained by the factors from the A&C Ecosystem. Another 49% is attributable to expertise in establishing and managing the level of total expenses. Only 3% of variation in total expenses is random.


For a listing of What Drives Performance from the A&C Ecosystem, see the Index-Specific Drivers for this Index?
What Drives Unrestricted Government Support?
What organizational characteristics affect this performance?
- Unrestricted government support increases with sector, budget size and organizational age. Government support is also higher for organizations that are in the midst of a capital campaign, spend more on fundraising or have proportionally higher total program expenses, charge very low ticket prices, or have higher attendance levels. Government support levels tend to be higher for organizations that target young adults, Asian Americans, African Americans or Hispanics/Latinos.
- Government support tends to be lower for organizations with more square footage relative to other organizations in their sector, those that recently completed a capital campaign, or offer more world premieres.
How do community arts and leisure characteristics affect performance?
- Unrestricted government support tends to be lower for organizations in communities with higher levels of total arts dollar activity, but higher with more artists and arts providers, and more public broadcast activity. Having more art museums, music organizations, orchestras, or PACs in a community tends to raise the tide of government support for all organizations in these sectors in the market.
- Having more organizations that compete for government support within the theatre, community, or general performing arts sectors drives down government support levels for all organizations in these sector.
How do socio-demographic characteristics of the community affect performance?
- Government support is higher for organizations in less densely populated communities and in communities where African Americans or Asian Americans make up a higher percentage of the population.
- Government support tends to be lower in communities where kids and young adults make up a higher percentage of the population or where median age in the community is higher. In markets where there is a higher socioeconomic level and the individual philanthropy level is higher, there tends to be lower levels of government support.
What Drives Total Expenses (before depreciation)?
What organizational characteristics affect this performance?
- Expenses increase with sector, organizational age, budget size, higher levels of local and state funding, and more programmatic offerings. Expenses also tend to be relatively higher for organizations target that young adults or Asian Americans.
- When organizations have a parent organization, primarily serve kids or African Americans, or offer a higher level of local or world premieres, expenses tend to be lower.
How do community arts and leisure characteristics affect performance?
- Expenses tend to be higher for organizations in communities with higher levels of total arts dollar activity and more leisure activities, which in this case act as complements.
- Having more organizations in the arts education, PAC, orchestra, and general performing arts sectors tends to increase budget size for all organizations in those sectors.
- Organizations tend to have lower expense levels when there is a high number of arts providers and artists in the community.
- Having more organizations that compete in the art museum and music sectors drives down expenses for all organizations in these sectors. In other words, the competition makes it more difficult for organizations in these sectors to grow in budget size.
How do socio-demographic characteristics of the community affect performance?
- Total expenses are higher for organizations in more densely populated communities and communities with a higher median age in the population, those with a higher socioeconomic level, and where the percentage of the population that is under 25, Hispanic/Latino, or Asian American is higher.
What impact does Public Funding have on performance?
- Higher overall state and federal grant activity in the local marketplace has no effect on total expenses.
Earned Revenue Index
What Drives Earned Revenue (before capital gains)?
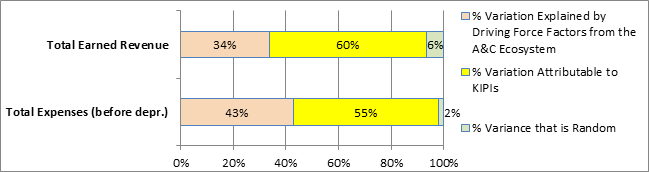
The driving force factors from the A&C Ecosystem explain 34% of variation in earned revenue, not including capital gains. The expertise at generating earned revenue drives 60% of performance, and 6% is attributable to random variation.
What Drives Total Expenses (before depreciation)?
43% of the variation in total expenses (before depreciation) is explained by the factors from the A&C Ecosystem. Another 55% is attributable to expertise in establishing and managing the level of total expenses. Only 2% of variation in total expenses is random.

For a listing of What Drives Performance from the A&C Ecosystem, see the Index-Specific Drivers for this Index?
What Drives Earned Revenue (before capital gains)?
What organizational characteristics affect this performance?
- Earned revenue increases with organizational age, square footage, budget size, the number of programmatic offerings, number of local premieres, median ticket price, the amount spent on marketing and on programming, the number of subscribers/members, total in-person attendance, targeting kids, and being awarded NEA or IMLS grants.
- When organizations receive higher levels of support from local or state government, present higher numbers of world premieres, or target Asian-Americans, African-Americans, or Hispanics/Latinos, earned revenue tends to be lower.
How do community arts and leisure characteristics affect performance?
- Earned revenue tends to be higher for organizations in communities with higher levels of total arts dollar activity and more public broadcast dollar activity.
- The more organizations in the arts education, community, and symphony orchestra sectors, the higher earned revenue for all organizations in each sector. By contrast, more sector competitors in music, opera, PACs, theatre, or ‘other’ museums drives down earned revenue for organizations in each of these sectors.
How do socio-demographic characteristics of the community affect performance?
- Earned revenue is higher for organizations in communities where total population is higher, the percentage of the population that is under 18, African-American, or Asian-American is higher, and the socioeconomic level is higher.
- As the median age or percentage of the population either Asian-American or African-American increase, earned revenue levels go down.
What impact does Public Funding have on performance?
- Government grant activity in the market had no effect on earned revenue.
What Drives Total Expenses (before depreciation)?
What organizational characteristics affect this performance?
- Higher total expenses – i.e., larger budgets – occur for older organizations, those with higher levels of local and state funding, a greater percentage of expenses spent on occupancy costs, more programmatic offerings, more members and/or subscribers, and a larger staff. Expenses also tend to be relatively higher for organizations that target kids, young adults, or Hispanics/Latinos.
- An organization’s arts and cultural sector has a big influence on its expected level of total expenses.
- When organizations target Asian-Americans or offer a higher level of local or world premieres, expenses tend to be Asian-Americans.
How do community arts and leisure characteristics affect performance?
- Expenses tend to be higher for organizations in communities with higher levels of total arts dollar activity, more public broadcast activity, and more leisure activities, which in this case act as complements.
- Having more organizations that compete in the arts education, community, dance, music, opera, PAC, orchestras, theatre, and general performing arts sectors drives down expenses for all organizations in the sector. In other words, the competition makes it more difficult for organizations in these sectors to grow in budget size.
How do socio-demographic characteristics of the community affect performance?
- Total expenses are higher for organizations in more densely populated communities, more philanthropic communities, and where the percentage of the population that is under 25 or Asian American is higher.
- As the percentage of the population that is African American increases, total expenses tend to be lower.
What impact does Public Funding have on performance?
- Where there is higher overall state and federal grant activity in the local marketplace, organizations tend to have larger budgets.
Earned Relational Revenue Index
What Drives Earned Relational Revenue from Subscriptions and Memberships?
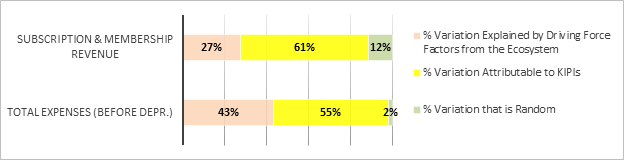
The driving force factors from the A&C Ecosystem explain 27% of variation in earned relational revenue. The expertise at generating earned relational revenue drives 61% of performance, and 12% is attributable to random variation.
What Drives Total Expenses (before depreciation)?
43% of the variation in total expenses (before depreciation) is explained by the factors from the A&C Ecosystem. Another 55% is attributable to expertise in establishing and managing the level of total expenses. Only 2% of variation in total expenses is random.

For a listing of What Drives Performance from the A&C Ecosystem, see the Index-Specific Drivers for this Index?
What Drives Earned Revenue (before capital gains)?
What organizational characteristics affect this performance?
- Earned revenue from subscriptions and memberships increases with sector, organizational age, square footage, budget size, the number of programmatic offerings, ticket price, the amount spent on marketing and on programming, website page views, targeting kids or young adults, and being awarded NEA or IMLS grants.
- When organizations have a higher number of programmatic offerings, present higher numbers of world premieres, or target Asian-Americans, African-Americans, or Hispanics/Latinos, earned revenue from subscribers and members tends to be lower.
How do community arts and leisure characteristics affect performance?
- Earned relational revenue tends to be higher for organizations in communities with higher levels of total arts dollar activity, total number of arts providers, more public broadcast dollar activity, and more leisure activities, which in this case act as complements.
- Having more organizations that compete in each arts and cultural sector drives down revenue earned from subscriptions and memberships for all organizations in the sector.
How do socio-demographic characteristics of the community affect performance?
- Earned relational revenue is higher for organizations in communities where total population is higher, median income is higher, and the percentage of the population that is under 18 or Asian-American is higher, and the socioeconomic level is higher.
- As the socioeconomic level increases or either the percentage of African-Americans or Hispanics/Latinos increases, earned revenue from subscriptions and memberships go down.
What impact does Public Funding have on performance?
- Government grant activity in the market has a positive effect on earned revenue from subscribers and members.
What Drives Total Expenses (before depreciation)?
What organizational characteristics affect this performance?
- Higher total expenses – i.e., larger budgets – occur for older organizations, those with higher levels of local and state funding, a greater percentage of expenses spent on occupancy costs, more programmatic offerings, more members and/or subscribers, and a larger staff. Expenses also tend to be relatively higher for organizations that target kids, young adults, or Hispanics/Latinos.
- An organization’s arts and cultural sector has a big influence on its expected level of total expenses.
- When organizations target Asian-Americans or offer a higher level of local or world premieres, expenses tend to be Asian-Americans.
How do community arts and leisure characteristics affect performance?
- Expenses tend to be higher for organizations in communities with higher levels of total arts dollar activity, more public broadcast activity, and more leisure activities, which in this case act as complements.
- Having more organizations that compete in the arts education, community, dance, music, opera, PAC, orchestras, theatre, and general performing arts sectors drives down expenses for all organizations in the sector. In other words, the competition makes it more difficult for organizations in these sectors to grow in budget size.
How do socio-demographic characteristics of the community affect performance?
- Total expenses are higher for organizations in more densely populated communities, more philanthropic communities, and where the percentage of the population that is under 25 or Asian American is higher.
- As the percentage of the population that is African American increases, total expenses tend to be lower.
What impact does Public Funding have on performance?
- Where there is higher overall state and federal grant activity in the local marketplace, organizations tend to have larger budgets.
Program Revenue per Attendee Index
What Drives Program Revenue?
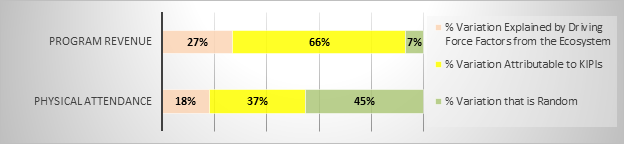
An organization’s program revenue is driven 327% by factors from the A&C Ecosystem. Another 66% is attributable to expertise in generating program revenue with the organization’s offerings and 7% is due to random variation.
What Drives Total In-person Attendance?
The driving force factors from the A&C Ecosystem explain 18% of total attendance by those who participate in the organization’s offerings in-person. Another 37% of attendance is attributable to expertise in attracting attendees, and 45% is attributable to random variation.

For a listing of What Drives Performance from the A&C Ecosystem, see the Index-Specific Drivers for this Index?
What Drives Program Revenue?
What organizational characteristics affect this performance?
- Program revenue, which includes all revenue earned through the attraction of attendees and participants, increases with organizational age, square footage, budget size, the number of programmatic offerings, number of local premieres, the amount spent on marketing and on programming, the number of subscribers/members, total in-person attendance, targeting kids or young adults, and being awarded NEA or IMLS grants.
- When organizations receive higher levels of support from local or state government, present higher numbers of world premieres, or target African-Americans or Hispanics/Latinos, program revenue tends to be lower.
How do community arts and leisure characteristics affect performance?
- Program revenue tends to be higher for organizations in communities with higher levels of total arts dollar activity, more public broadcast dollar activity, and more leisure activities that act as complements to the art and cultural activity.
- The more organizations in the arts education and symphony orchestra sectors, the higher earned revenue for all organizations in each sector. By contrast, more sector competitors in the art museum, dance, music, opera, PAC, or theatre sectors drives down program revenue for organizations in each of these sectors.
How do socio-demographic characteristics of the community affect performance?
- Program revenue is higher for organizations in communities where total population is higher and the socioeconomic level is higher.
- As the median age or percentage of the population either Asian-American or African-American increase, program revenue levels go down.
What impact does Public Funding have on performance?
- Government grant activity in the local market had no effect on program revenue.
What Drives In-person Attendance?
What organizational characteristics affect this performance?
- In-person attendance increases with organizational age, square footage, budget size, the number of local and national premieres, the amount spent on marketing, the number of members, the number of website page views, and being awarded NEA or IMLS grants.
- Attendance tends to be higher when organizations receive higher levels of support from local government, and when the organization targets either kids or Asian Americans.
- Attendance tends to be lower for organizations that target young adults or African Americans.
- Attendance is negatively affected when the lowest ticket price is still relatively high.
How do community arts and leisure characteristics affect performance?
- In-person attendance tends to be higher for organizations in communities with high total arts dollar activity, and more leisure activities, which act as complements.
- Attendance tends to be lower for organizations in communities with more artists and arts providers or more public broadcast dollar activity.
- The greater the number of within-sector competitors the lower the attendance for organizations within the sectors.
How do socio-demographic characteristics of the community affect performance?
- Physical attendance is higher in communities where the total population is larger. It tends to be lower when the socioeconomic level and median age are higher. It is also lower if the organization is in a market with a higher percentage of the population under 25, Hispanic/Latino or African-American.
What impact does Public Funding have on performance?
- Physical attendance is lower in communities with higher state and federal government grant activity in the local market.
Investment in Program Index
What Drives Total Program Expenses?
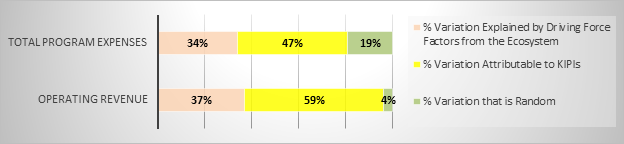
Factors from the A&C Ecosystem drive 34% of organization’s total program expenses, including payment to artists, program-related personnel, and non-personnel costs such as physical production materials, collections conservation and management, program-related equipment rentals and repairs, company management, housing/travel, etc. Another 47% is attributable to expertise in setting and managing the investment level in programmatic activities and 19% is due to random variation.
What Drives Operating Revenue?
The driving force factors from the A&C Ecosystem explain 37% of total operating revenue. Another 59% of attendance is attributable to expertise in generating and managing revenue, and 4% is attributable to random variation.

For a listing of What Drives Performance from the A&C Ecosystem, see the Index-Specific Drivers for this Index?
What Drives Total Program Expenses?
What organizational characteristics affect this performance?
- Total program expenses increase with organizational age, square footage, budget size, higher working capital, the number of programmatic offerings, number of artists and program personnel hired, number of local premieres, overall staff size, the number of subscribers/members, median ticket price, higher levels of support from local or state government, and being awarded NEA or IMLS grants.
- When organizations present higher numbers of world premieres, program expenses tend to be lower.
- Organizations that target kids, young adults, or African-Americans tend to have higher program expenses.
How do community arts and leisure characteristics affect performance?
- Program expenses tend to be higher for organizations in communities with higher levels of total arts dollar activity, more public broadcast dollar activity, and more artists and arts providers.
- The more organizations in the symphony orchestra sector, the higher program expenses tend to be for all organizations in that sector. By contrast, more within-sectors competitors in art museums, dance, music, PAC, ‘other’ museums, or theatre drives down program expenses for organizations in each of these sectors.
How do socio-demographic characteristics of the community affect performance?
- Program expenses are higher for organizations in communities where total population is higher, the socioeconomic level is higher, and there is a higher percentage of the population either 18-25 years old or Asian-American.
- As the median age increases, program expense levels go down.
What impact does Public Funding have on performance?
- Higher state and federal grant activity in the local market leads to higher total program expenses.
What Drives Operating Revenue?
What organizational characteristics affect this performance?
- Operating revenue tends to be higher with organizational age, square footage, budget size, the number of local premieres, targeting young adults or African-Americans, and being awarded NEA or IMLS grants.
- Higher levels of local government support and targeting Asian-Americans tend to lead to lower operating revenue.
How do community arts and leisure characteristics affect performance?
- Operating revenue tends to be higher for organizations in communities with more public broadcast dollar activity, higher total arts dollar activity, more artists and arts providers.
- The more organizations in the ‘other’ museum sector, the higher the operating revenue for all organizations in that sector. By contrast, having more within-sector competitors in community, dance, music, PACs, theatre, and general performing arts drives down operating revenue for organizations within these sectors.
How do socio-demographic characteristics of the community affect performance?
- Operating revenue is lower in communities where the total population is larger, the socioeconomic level is higher, and there are a higher percentage of kids.
- When communities have a higher percentage of the population that is African-Americans or Hispanics/Latinos or when median age is high, operating revenue tends to be lower.
What impact does Public Funding have on performance?
- Government grant activity in the local market was unrelated to operating revenue.
Investment in Program Personnel Index
What Drives Salaried and Non-salaried Artist and Program Personnel Expenses?
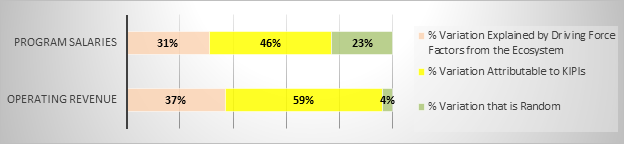
An organization’s total payment to artists and program personnel is driven 31% by factors from the A&C Ecosystem. Another 46% is attributable to expertise in setting and managing the investment level in artist and program salaries and 23% is due to random variation.
What Drives Operating Revenue?
The driving force factors from the A&C Ecosystem explain 37% of total operating revenue. Another 59% of attendance is attributable to expertise in generating and managing revenue, and 4% is attributable to random variation.

For a listing of What Drives Performance from the A&C Ecosystem, see the Index-Specific Drivers for this Index?
What Drives Salaried and Non-salaried Artist and Program Personnel Expenses?
What organizational characteristics affect this performance?
- Program personnel expenses increase with organizational age, budget size, higher working capital, number of programmatic offerings, number of artists and program personnel hired, overall staff size, median ticket price, higher levels of support from local or state government, and being awarded NEA or IMLS grants.
- When organizations present higher numbers of local or world premieres, program personnel expenses tend to be lower.
- Organizations that target kids or Hispanics/Latinos tend to have higher program personnel expenses while those targeting Asian-Americans or young adults have lower payment to program personnel.
How do community arts and leisure characteristics affect performance?
-
Program personnel expenses tend to be higher for organizations in communities with higher levels of total arts dollar activity,
moreand less public broadcast dollar activity, and more other leisure activities. - The more organizations in every sector except art museums, the lower program salaries in that sector.
How do socio-demographic characteristics of the community affect performance?
- Program personnel expenses are higher for organizations in communities where there is a higher populations, and lower where there is a higher percentage of the population under 18 or African-American or Hispanic/Latino, or a there is a higher socioeconomic level.
What impact does Public Funding have on performance?
- Higher state and federal grant activity in the local market leads to higher total program personnel expenses.
What Drives Operating Revenue?
What organizational characteristics affect this performance?
- Operating revenue tends to be higher with organizational age, square footage, budget size, the number of local premieres, targeting young adults or African-Americans, and being awarded NEA or IMLS grants.
- Higher levels of local government support and targeting Asian-Americans tend to lead to lower operating revenue.
How do community arts and leisure characteristics affect performance?
- Operating revenue tends to be higher for organizations in communities with more public broadcast dollar activity, higher total arts dollar activity, more artists and arts providers.
- The more organizations in the ‘other’ museum sector, the higher the operating revenue for all organizations in that sector. By contrast, having more within-sector competitors in community, dance, music, PACs, theatre, and general performing arts drives down operating revenue for organizations within these sectors.
How do socio-demographic characteristics of the community affect performance?
- Operating revenue is lower in communities where the total population is larger, the socioeconomic level is higher, and there are a higher percentage of kids.
- When communities have a higher percentage of the population that is African-Americans or Hispanics/Latinos or when median age is high, operating revenue tends to be lower.
What impact does Public Funding have on performance?
- Government grant activity in the local market was unrelated to operating revenue.
Response to Marketing Efforts Index
What Drives Total Marketing Expenses?
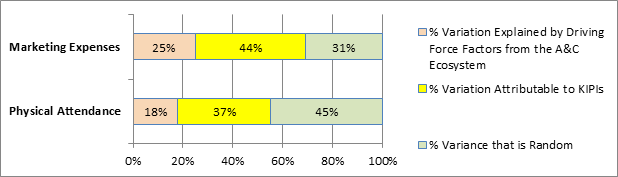
The driving force factors from the A&C Ecosystem explain 25% of total marketing expenses, including personnel and non-personnel costs. Another 44% of attendance is attributable to expertise in establishing and managing the right level of marketing expenses, and 31% is attributable to random variation.
What Drives Total In-person Attendance?
The driving force factors from the A&C Ecosystem explain 18% of total attendance by those who participate in the organization’s offerings in-person. Another 37% of attendance is attributable to expertise in attracting attendees, and 45% is attributable to random variation.

For a listing of What Drives Performance from the A&C Ecosystem, see the Index-Specific Drivers for this Index?
What Drives Total Marketing Expenses?
What organizational characteristics affect this performance?
- Higher total marketing expenses tend to occur for older and larger-budget organizations, those with high levels of funding from local or state government, and those that receive NEA or IMLS grants. Total marketing expenses also are higher for those organizations with more administrative employees, larger overall staffs, who offer more programming, and present more local premieres.
- Total marketing expenses tend to be lower for organizations that target those under 25, African-Americans or Hispanics/Latinos.
How do community arts and leisure characteristics affect performance?
- Total marketing expenses are higher for organizations in communities with more public broadcast dollar activity, and more leisure activities, which in this case act as complements.
- The more symphony orchestras, the higher the marketing budget tends to be for the organizations in this sector. By contrast, having more arts education organizations, art museums, community organizations, dance companies, music organizations, opera companies or theatre companies in a market tends to mean lower marketing budgets for those competing within each of these sectors.
How do socio-demographic characteristics of the community affect performance?
- Total marketing expenses are lower in communities with larger populations, higher median age, a higher percentage 18-24-year olds, or a higher percentage of Asian-Americans, African-Americans or Hispanics/Latinos.
What impact does Public Funding have on performance?
- Government grant activity in the local market had no relationship with total marketing expenses.
What Drives In-person Attendance?
What organizational characteristics affect this performance?
- In-person attendance increases with organizational age, square footage, budget size, the number of local and national premieres, the amount spent on marketing, the number of members, the number of website page views, and being awarded NEA or IMLS grants.
- Attendance tends to be higher when organizations receive higher levels of support from local government, and when the organization targets either kids or Asian Americans.
- Attendance tends to be lower for organizations that target young adults or African Americans.
- Attendance is negatively affected when the lowest ticket price is still relatively high.
How do community arts and leisure characteristics affect performance?
- In-person attendance tends to be higher for organizations in communities with high total arts dollar activity, and more leisure activities, which act as complements.
- Attendance tends to be lower for organizations in communities with more artists and arts providers or more public broadcast dollar activity.
- The greater the number of within-sector competitors the lower the attendance for organizations within the sectors.
How do socio-demographic characteristics of the community affect performance?
- Physical attendance is higher in communities where the total population is larger. It tends to be lower when the socioeconomic level and median age are higher. It is also lower if the organization is in a market with a higher percentage of the population under 25, Hispanic/Latino or African-American.
What impact does Public Funding have on performance?
- Physical attendance is lower in communities with higher state and federal government grant activity in the local market.
Response to Direct Marketing Spend Index
What Drives Direct (non-staff) Marketing Spend?
The driving force factors from the A&C Ecosystem explain 10% of marketing expenses, including only non-personnel costs. Another 13% of attendance is attributable to expertise in establishing and managing the right level of marketing expenses, and a rather large portion --77% -- is attributable to random variation.
What Drives Total In-person Attendance?
The driving force factors from the A&C Ecosystem explain 18% of total attendance by those who participate in the organization’s offerings in-person. Another 37% of attendance is attributable to expertise in attracting attendees, and 45% is attributable to random variation.

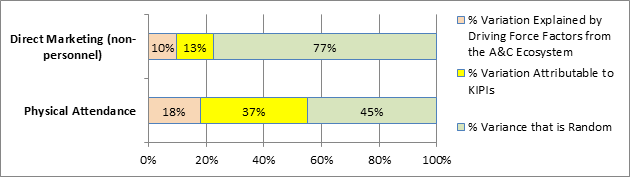
For a listing of What Drives Performance from the A&C Ecosystem, see the Index-Specific Drivers for this Index?
What Drives Direct (non-staff) Marketing Spend?
What organizational characteristics affect this performance?
- Higher direct (non-staff) marketing expenses tend to occur for older organizations, those with larger budgets, larger boards, more square footage, higher occupancy expenses, those with high levels of funding from local or state government, and those that receive NEA or IMLS grants. Direct marketing expenses also are higher for those organizations with more total offerings, with a higher median ticket price, and present more local and world premieres.
- Total marketing expenses tend to be lower for organizations that target those under 25, African-Americans or Hispanics/Latinos.
How do community arts and leisure characteristics affect performance?
- Total marketing expenses are higher for organizations in communities with more public broadcast dollar activity, and more artists and arts providers.
- The more community organizations, the higher the direct marketing budget tends to be for the organizations in this sector. By contrast, having more opera companies, PACs, or theatre companies in a market tends to mean lower direct marketing budgets for those competing within each of these sectors.
How do socio-demographic characteristics of the community affect performance?
- Direct marketing expenses are higher in communities with higher median age, a higher percentage of people under 25, or a higher percentage of Asian-Americans. By contrast, they are lower in markets with a larger population, higher socio-economic level, or a high percentage of African-Americans.
What impact does Public Funding have on performance?
- Higher state and federal government grant activity in the local market lowered direct marketing expenses.
What Drives In-person Attendance?
What organizational characteristics affect this performance?
- In-person attendance increases with organizational age, square footage, budget size, the number of local and national premieres, the amount spent on marketing, the number of members, the number of website page views, and being awarded NEA or IMLS grants.
- Attendance tends to be higher when organizations receive higher levels of support from local government, and when the organization targets either kids or Asian Americans.
- Attendance tends to be lower for organizations that target young adults or African Americans.
- Attendance is negatively affected when the lowest ticket price is still relatively high.
How do community arts and leisure characteristics affect performance?
- In-person attendance tends to be higher for organizations in communities with high total arts dollar activity, and more leisure activities, which act as complements.
- Attendance tends to be lower for organizations in communities with more artists and arts providers or more public broadcast dollar activity.
- The greater the number of within-sector competitors the lower the attendance for organizations within the sectors.
How do socio-demographic characteristics of the community affect performance?
- Physical attendance is higher in communities where the total population is larger. It tends to be lower when the socioeconomic level and median age are higher. It is also lower if the organization is in a market with a higher percentage of the population under 25, Hispanic/Latino or African-American.
What impact does Public Funding have on performance?
- Physical attendance is lower in communities with higher state and federal government grant activity in the local market.
Return on Marketing Efforts Index
What Drives Program Revenue?
An organization’s program revenue is driven 27% by factors from the A&C Ecosystem. Another 66% is attributable to expertise in generating program revenue with the organization’s offerings and 7% is due to random variation.
What Drives Total Marketing Expenses?
The driving force factors from the A&C Ecosystem explain 25% of total marketing expenses, including personnel and non-personnel costs. Another 44% of attendance is attributable to expertise in establishing and managing the right level of marketing expenses, and 31% is attributable to random variation.

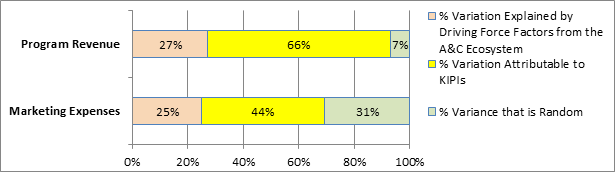
For a listing of What Drives Performance from the A&C Ecosystem, see the Index-Specific Drivers for this Index?
What Drives Program Revenue?
What organizational characteristics affect this performance?
- Program revenue, which includes all revenue earned through the attraction of attendees and participants, increases with organizational age, square footage, budget size, the number of programmatic offerings, number of local premieres, the amount spent on marketing and on programming, the number of subscribers/members, total in-person attendance, targeting kids or young adults, and being awarded NEA or IMLS grants.
- When organizations receive higher levels of support from local or state government, present higher numbers of world premieres, or target African-Americans or Hispanics/Latinos, program revenue tends to be lower.
How do community arts and leisure characteristics affect performance?
- Program revenue tends to be higher for organizations in communities with higher levels of total arts dollar activity, more public broadcast dollar activity, and more leisure activities that act as complements to the art and cultural activity.
- The more organizations in the arts education and symphony orchestra sectors, the higher earned revenue for all organizations in each sector. By contrast, more sector competitors in the art museum, dance, music, opera, PAC, or theatre sectors drives down program revenue for organizations in each of these sectors.
How do socio-demographic characteristics of the community affect performance?
- Program revenue is higher for organizations in communities where total population is higher and the socioeconomic level is higher.
- As the median age or percentage of the population either Asian-American or African-American increase, program revenue levels go down.
What impact does Public Funding have on performance?
- Government grant activity in the local market had no effect on program revenue.
What Drives Total Marketing Expenses?
What organizational characteristics affect this performance?
- Higher total marketing expenses tend to occur for older and larger-budget organizations, those with high levels of funding from local or state government, and those that receive NEA or IMLS grants. Total marketing expenses also are higher for those organizations with more administrative employees, larger overall staffs, who offer more programming, and present more local premieres.
- Total marketing expenses tend to be lower for organizations that target those under 25, African-Americans or Hispanics/Latinos.
How do community arts and leisure characteristics affect performance?
- Total marketing expenses are higher for organizations in communities with more public broadcast dollar activity, and more leisure activities, which in this case act as complements.
- The more symphony orchestras, the higher the marketing budget tends to be for the organizations in this sector. By contrast, having more arts education organizations, art museums, community organizations, dance companies, music organizations, opera companies or theatre companies in a market tends to mean lower marketing budgets for those competing within each of these sectors.
How do socio-demographic characteristics of the community affect performance?
- Total marketing expenses are lower in communities with larger populations, higher median age, a higher percentage of 18-24-year olds, or a higher percentage of Asian-Americans, African-Americans or Hispanics/Latinos.
What impact does Public Funding have on performance?
- Government grant activity in the local market had no relationship with total marketing expenses.
Return on Direct Marketing Spend Index
What Drives Program Revenue?
An organization’s program revenue is driven 27% by factors from the A&C Ecosystem. Another 66% is attributable to expertise in generating program revenue with the organization’s offerings and 7% is due to random variation.
What Drives Direct (non-staff) Marketing Spend?
The driving force factors from the A&C Ecosystem explain 10% of marketing expenses, including only non-personnel costs. Another 13% is attributable to expertise in establishing and managing the right level of marketing expenses, and 77% is attributable to random variation.

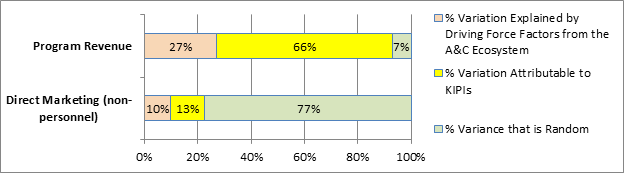
For a listing of What Drives Performance from the A&C Ecosystem, see the Index-Specific Drivers for this Index?
What Drives Program Revenue?
What organizational characteristics affect this performance?
- Program revenue, which includes all revenue earned through the attraction of attendees and participants, increases with organizational age, square footage, budget size, the number of programmatic offerings, number of local premieres, the amount spent on marketing and on programming, the number of subscribers/members, total in-person attendance, targeting kids or young adults, and being awarded NEA or IMLS grants.
- When organizations receive higher levels of support from local or state government, present higher numbers of world premieres, or target African-Americans or Hispanics/Latinos, program revenue tends to be lower.
How do community arts and leisure characteristics affect performance?
- Program revenue tends to be higher for organizations in communities with higher levels of total arts dollar activity, more public broadcast dollar activity, and more leisure activities that act as complements to the art and cultural activity.
- The more organizations in the arts education and symphony orchestra sectors, the higher earned revenue for all organizations in each sector. By contrast, more sector competitors in the art museum, dance, music, opera, PAC, or theatre sectors drives down program revenue for organizations in each of these sectors.
How do socio-demographic characteristics of the community affect performance?
- Program revenue is higher for organizations in communities where total population is higher and the socioeconomic level is higher.
- As the median age or percentage of the population either Asian-American or African-American increase, program revenue levels go down.
What impact does Public Funding have on performance?
- Government grant activity in the local market had no effect on program revenue.
What Drives Direct (non-staff) Marketing Spend?
What organizational characteristics affect this performance?
- Higher direct (non-staff) marketing expenses tend to occur for older organizations, those with larger budgets, larger boards, more square footage, higher occupancy expenses, those with high levels of funding from local or state government, and those that receive NEA or IMLS grants. Direct marketing expenses also are higher for those organizations with more total offerings, with a higher median ticket price, and present more local and world premieres.
- Total marketing expenses tend to be lower for organizations that target those under 25, African-Americans or Hispanics/Latinos.
How do community arts and leisure characteristics affect performance?
- Total marketing expenses are higher for organizations in communities with more arts dollar activity.
- The more organizations in each sector, the lower direct marketing costs.
How do socio-demographic characteristics of the community affect performance?
-
Direct marketing expenses are higher in communities with higher total population, or a higher percentage of Hispanics/Latinos. By contrast, they are lower in markets with
amore children, higher median age, or a high percentage of African-Americans.
What impact does Public Funding have on performance?
- Higher state and federal government grant activity in the local market lowered direct marketing expenses.
Unrestricted Surplus (Deficit) Index
This bottom line figure is a formula created by subtracting total expenses (before depreciation) from total unrestricted revenue (before capital gains), then dividing by total expenses (before depreciation) to get a sense of the surplus/deficit relative to annual budget.
What Drives Total Unrestricted Revenue (before capital gains)?
38% of the variation in total unrestricted revenue (before capital gains) is explained by the factors from the A&C Ecosystem. Another 56% is attributable to expertise in attracting and managing the level of unrestricted revenue and 3% of variation in total expenses is random.
What Drives Total Expenses (before depreciation)?
43% of the variation in total expenses (before depreciation) is explained by the factors from the A&C Ecosystem. Another 55% is attributable to expertise in establishing and managing the level of total expenses. Only 2% of variation in total expenses is random.

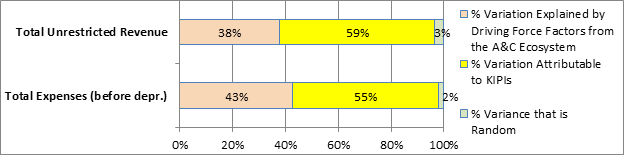
For a listing of What Drives Performance from the A&C Ecosystem, see the Index-Specific Drivers for this Index?
What Drives Total Unrestricted Revenue and Total Expenses?
The numerator of this bottom line figure is a formula created by subtracting total expenses (before depreciation) from total unrestricted revenue (before capital gains), and the denominator is total expenses (before depreciation). Here we take a combined look at what drives the component parts.
What organizational characteristics affect this performance?
- Unrestricted revenue and expenses both increase with organizational age, organizational size, and with a higher number of programmatic offerings. They both decrease with targeting of Asian-Americans. Targeting Hispanics/Latinos also tends to result in lower unrestricted revenue, but it tends to lead to increased expenses.
- Square footage, total investments, and fixed assets are positively related to unrestricted revenue, as is receipt of NEA or IMLS funding, having a parent organization, being in a capital or endowment campaign, or spending more on marketing, fundraising, and programming.
- Higher occupancy costs and larger staffs drive higher expenses, as do the number of members or subscribers.
- More national premieres drive down expenses and unrestricted revenue. Local premieres drive up unrestricted revenue and they drive down expenses. Unrestricted revenue and expenses also tend to be relatively higher for organizations that target young adults.
- Higher local and state government funding is associated with higher levels of unrestricted revenue and expenses.
How do community arts and leisure characteristics affect performance?
- Unrestricted revenue tends to be higher for organizations in communities with more artists and arts providers. Both revenue and expenses rise with higher levels of total arts dollar activity and with more leisure activities that act as complements to the art and cultural activity. Expenses tend to be higher for organizations in communities with more public broadcast dollar activity.
- Having more organizations that compete in the arts education, community, dance, music, opera, PAC, orchestras, theatre, and general performing arts sectors drives down expenses for all organizations in the sector. In other words, the competition makes it more difficult for organizations in these sectors to grow in budget size.
- The more opera companies, the greater their tendency towards higher unrestricted revenue. Having more organizations compete in all other sectors tends to drive down unrestricted revenue for all organizations in those sectors.
How do socio-demographic characteristics of the community affect performance?
- Unrestricted revenue and expenses are higher for organizations in more populated communities and in more philanthropic communities.
- As the median age or percentage of the population either Asian-American or under 25 increase, unrestricted revenue levels and expenses go up. Unrestricted revenue and expenses tend to be lower in communities with a high percentage of African Americans.
What impact does Public Funding have on performance?
- State and federal government grant activity in the local market had a negative relationship with unrestricted revenue but a positive impact on expenses.
Operating Bottom Line (before depreciation) Index
This bottom line figure is a formula created by subtracting total expenses (before depreciation) from total unrestricted operating revenue (it excludes unrestricted revenue attracted for non-operating purposes), then dividing by total expenses (before depreciation) to get a sense of the bottom line relative to annual budget.
What Drives Total Operating Revenue?
37% of the variation in total unrestricted revenue (before capital gains) is explained by the factors from the A&C Ecosystem. Another 59% is attributable to expertise in attracting and managing the level of operating revenue and 4% of variation in total expenses is random.
What Drives Total Expenses (before depreciation)?
43% of the variation in total expenses (before depreciation) is explained by the factors from the A&C Ecosystem. Another 55% is attributable to expertise in establishing and managing the level of total expenses. Only 2% of variation in total expenses is random.

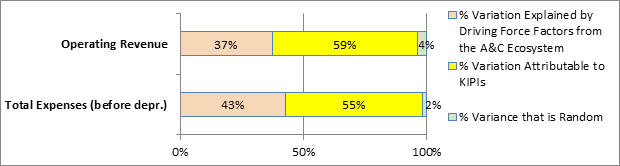
For a listing of What Drives Performance from the A&C Ecosystem, see the Index-Specific Drivers for this Index?
What Drives Unrestricted Operating Revenue and Total Expenses (before depr.)?
The numerator of this bottom line figure is a formula created by subtracting total expenses (before depreciation) from unrestricted operating revenue, which is different from total unrestricted revenue in that it does not include revenue for non-operating purposes. The denominator is expenses (before depreciation). Here we take a combined look at what drives the component parts of operating surplus (deficit).
What organizational characteristics affect this performance?
- Operating revenue and expenses both increase with organizational age, budget size, higher levels of local and state government funding, and more programmatic offerings.
- Operating revenue rises when organizations are awarded NEA or IMLS grants, and when organizations spend more on fundraising and marketing.
- More square footage tends to drive higher operating revenue while higher occupancy costs tend to drive higher overall expenses.
- More world premieres drive down both operating revenue and expenses. More local premieres tend to lead to higher expenses but have no effect on operating revenue.
- Organizations that target young adults tend to have higher operating revenue and expenses. Targeting kids or Hispanics/Latinos tends to lead to higher expenses and lower operating revenue.
How do community arts and leisure characteristics affect performance?
- Operating revenue and expenses tend to be higher for organizations in communities with higher total arts dollar activity and more leisure options, which act in this case as complements. Operating revenue also tends to rise when there are more artists and arts providers in the community. Public broadcast dollar activity in the market tends to lead to higher expenses and lower operating revenue.
- Having more organizations that compete in the arts education, community, dance, music, opera, PAC, orchestras, theatre, and general performing arts sectors drives down expenses for all organizations in the sector. In other words, the competition makes it more difficult for organizations in these sectors to grow in budget size.
- The more opera companies, the greater their tendency towards higher unrestricted revenue. Having more organizations compete in all other sectors tends to drive down unrestricted revenue for all organizations in those sectors.
How do socio-demographic characteristics of the community affect performance?
- Operating revenue and expenses are higher in communities where the total population is larger, the community is more philanthropic, and there are a higher percentage of kids. A higher median age in the community tends to drive up operating revenue but it has no effect on expenses.
- When communities have a higher percentage of the population that is Asian American, African American or Hispanics/Latinos, operating revenue tends to be lower. Expenses also are lower when a larger percentage of the community is African American and higher with a larger proportion of Asian Americans. More people in the community aged 25 or younger drive up both expenses and operating revenue.
What impact does Public Funding have on performance?
- Government grant activity in the local market tends to drive down operating revenue but increase total expenses.
Operating Bottom Line (after depreciation) Index
This bottom line figure is a formula created by subtracting total expenses (after depreciation) from total unrestricted operating revenue (it excludes unrestricted revenue attracted for non-operating purposes), then dividing by total expenses (after depreciation) to get a sense of the bottom line relative to annual budget.
What Drives Total Operating Revenue?
37% of the variation in total unrestricted revenue (before capital gains) is explained by the factors from the A&C Ecosystem. Another 59% is attributable to expertise in attracting and managing the level of operating revenue and 4% of variation in total expenses is random.
What Drives Total Expenses (after depreciation)?
43% of the variation in total expenses (after depreciation) is explained by the factors from the A&C Ecosystem. Another 55% is attributable to expertise in establishing and managing the level of total expenses. Only 2% of variation in total expenses is random.

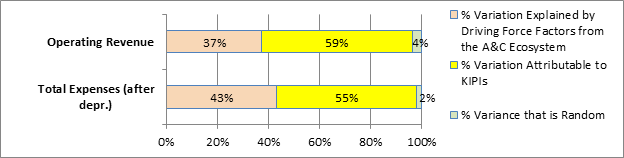
For a listing of What Drives Performance from the A&C Ecosystem, see the Index-Specific Drivers for this Index?
What Drives Unrestricted Operating Revenue and Total Expenses (after depr.)?
The numerator of this bottom line figure is a formula created by subtracting total expenses (after depreciation) from unrestricted operating revenue, which is different from total unrestricted revenue in that it does not include revenue for non-operating purposes. The denominator is total expenses (after depreciation). Here we take a combined look at what drives the component parts of operating surplus (deficit), taking into account the effects of depreciation expense.
What organizational characteristics affect this performance?
- Operating revenue and expenses both increase with organizational age, budget size, higher levels of local and state government funding, more square footage, and more programmatic offerings.
- Operating revenue rises when organizations are awarded NEA or IMLS grants, and when organizations spend more on fundraising and marketing.
- More fixed assets and full-time employees tend to drive higher overall expenses, as do more subscribers and members.
- More world premieres drive down operating revenue.
- Organizations that target young adults tend to have higher operating revenue and expenses. Targeting kids tends to lead to higher expenses and lower operating revenue.
How do community arts and leisure characteristics affect performance?
- Operating revenue and expenses tend to be higher for organizations in communities with higher total arts dollar activity and more leisure options, which act in this case as complements. Operating revenue also tends to rise when there are more artists and arts providers in the community. Public broadcast dollar activity in the market tends to lead to higher expenses and lower operating revenue.
- Having more organizations that compete in the arts education, community, dance, music, opera, theatre, and general performing arts sectors drives down expenses for all organizations in the sector. In other words, the competition makes it more difficult for organizations in these sectors to grow in budget size.
- The more opera companies, the greater their tendency towards higher unrestricted revenue. Having more organizations compete in all other sectors tends to drive down unrestricted revenue for all organizations in those sectors.
How do socio-demographic characteristics of the community affect performance?
- Operating revenue and expenses are higher in communities where the total population is larger, the community is more philanthropic, and there are a higher percentage of kids. A higher median age in the community tends to drive up operating revenue but it has no effect on expenses.
- When communities have a higher percentage of the population that is Asian American, African American or Hispanics/Latinos, operating revenue tends to be lower. Expenses also are lower when a larger percentage of the community is African American and higher with a larger proportion of Asian Americans. More people in the community aged 25 or younger drive up both expenses and operating revenue.
What impact does Public Funding have on performance?
- Government grant activity in the local market tends to drive down operating revenue but increase total expenses.
Months of Working Capital Index
Working capital is a formula created by subtracting unrestricted current liabilities from unrestricted current assets, then dividing by total expenses (before depreciation) to get a sense of working capital relative to annual budget. Finally, we multiply this percentage by 12 to assess the number of months of working capital.
What Drives Unrestricted Current Assets?
24% of the variation in total unrestricted current assets is explained by the factors from the A&C Ecosystem. Nearly three-quarters – 73% -- is attributable to expertise in establishing and managing the level of current assets and 3% of variation in total expenses is random.
What Drives Unrestricted Current Liabilities?
17% of the variation in total unrestricted liabilities is explained by the factors from the A&C Ecosystem. Another 61% is attributable to expertise in establishing and managing the level of current liabilities and 4% of variation in total expenses is random.
What Drives Total Expenses (before depreciation)?
43% of the variation in total expenses (before depreciation) is explained by the factors from the A&C Ecosystem. Another 55% is attributable to expertise in establishing and managing the level of total expenses. Only 2% of variation in total expenses is random.

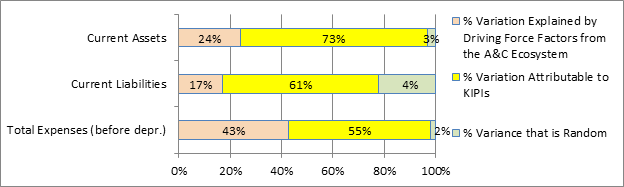
For a listing of What Drives Performance from the A&C Ecosystem, see the Index-Specific Drivers for this Index?
What Drives Unrestricted Current Assets and Unrestricted Current Liabilities?
Working capital is a formula created by subtracting unrestricted current liabilities from unrestricted current assets. To understand the difference between the two, we look at what drives each of the component parts.
What organizational characteristics affect this performance?
- Organizations currently in a capital or endowment campaign have higher current assets, as do those with higher levels of investments and fixed assets. Those that receive higher levels of local funding have lower current assets. Higher state funding leads to lower current assets and higher current liabilities, so lower working capital.
- Both current assets and current liabilities increase with organizational age and budget size, and when the organization receives NEA or IMLS funding. Organizations with higher occupancy expenses have higher current liabilities.
- Organizations that target kids (preK-12) have higher current assets and lower current liabilities – so higher working capital -- whereas those targeting African-Americans have higher current liabilities. Current assets and current liabilities are lower for organizations that target Asian-Americans.
How do community arts and leisure characteristics affect performance?
- Current assets and current liabilities tend to be higher for organizations in communities with higher levels of total arts dollar activity and more leisure activities that act as complements to the art and cultural activity.
- Having more artists and arts providers in a community tend to drive up current assets and drive down current liabilities, so higher working capital. By contrast, more public broadcast dollar activity drive down current assets and increase current liabilities, so lower working capital.
- The more arts education and music organization within-sector competition, the higher current assets and the lower current liabilities, so the higher working capital.
- The more organizations in the dance sector, the higher both current assets and liabilities for organizations in that sector. The more community organizations, ‘other’ museums, and general performing arts organizations in a market, the lower the current assets and liabilities for organizations in those sectors. Current asset levels are unaffected but current liabilities are lower when within-sector competition is more intense in the opera companies and art museums. Competition among theatres drives down current assets but has no effect on current liabilities.
How do socio-demographic characteristics of the community affect performance?
- Higher socioeconomic level and a higher percentage of kids in the community increase current assets while higher median age and more young adults in the market are associated with higher current liabilities. Total population drives up both.
- As the percentage of the population Asian-American increases, current liabilities decrease.
What impact does Public Funding have on performance?
- State and federal government grant activity in the local market positively impact both current assets and current liabilities.
What Drives Total Expenses (before depreciation)?
What organizational characteristics affect this performance?
- Higher total expenses – i.e., larger budgets – occur for older organizations, those with higher levels of local and state funding, a greater percentage of expenses spent on occupancy costs, more programmatic offerings, more members and/or subscribers, and a larger staff. Expenses also tend to be relatively higher for organizations that target kids, young adults, or Hispanics/Latinos.
- An organization’s arts and cultural sector has a big influence on its expected level of total expenses.
- When organizations target Asian-Americans or offer a higher level of local or world premieres, expenses tend to be Asian-Americans.
How do community arts and leisure characteristics affect performance?
- Expenses tend to be higher for organizations in communities with higher levels of total arts dollar activity, more public broadcast activity, and more leisure activities, which in this case act as complements.
- Having more organizations that compete in the arts education, community, dance, music, opera, PAC, orchestras, theatre, and general performing arts sectors drives down expenses for all organizations in the sector. In other words, the competition makes it more difficult for organizations in these sectors to grow in budget size.
How do socio-demographic characteristics of the community affect performance?
- Total expenses are higher for organizations in more densely populated communities, more philanthropic communities, and where the percentage of the population that is under 25 or Asian American is higher.
- As the percentage of the population that is African American increases, total expenses tend to be lower.
What impact does Public Funding have on performance?
- Where there is higher overall state and federal grant activity in the local marketplace, organizations tend to have larger budgets.
Months of Available Cash Index
What Drives Unrestricted & Temporarily Restricted Cash, Cash Equivalents, Investments, and Line of Credit Limit?
The driving force factors from the A&C Ecosystem explain 18% of available unrestricted and temporarily restricted cash, cash equivalents, investments, and line of credit limit. The expertise at managing liquidity and access cash drives 79% of performance, and 4% is attributable to random variation.
What Drives Total Expenses (before depreciation)?
43% of the variation in total expenses (before depreciation) is explained by the factors from the A&C Ecosystem. Another 55% is attributable to expertise in establishing and managing the level of total expenses. Only 2% of variation in total expenses is random.

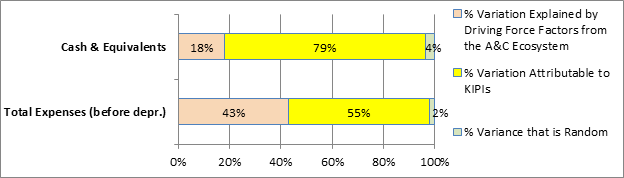
For a listing of What Drives Performance from the A&C Ecosystem, see the Index-Specific Drivers for this Index?
What Drives Unrestricted & Temporarily Restricted Cash, Cash Equivalents, Investments, and Line of Credit Limit?
What organizational characteristics affect this performance?
- Greater cash and access to cash tends to occur for organizations in a capital or endowment campaign, older organizations, those with larger budgets or higher fixed assets, those with high levels of funding from local government, and those that receive NEA or IMLS grants.
- The level of available cash tends to be higher for organizations that target either kids or Hispanics/Latinos, and lower for organizations that target those under 25, African-Americans or those that receive higher levels of state government funding.
How do community arts and leisure characteristics affect performance?
- Organizations in communities with more artists and arts providers and higher levels of arts dollar activity tend to have higher levels of available cash.
- The more competing arts education organizations, community organizations, dance companies, music organizations, PACs, and symphony orchestras, the higher the available cash for the organizations in those sectors. By contrast, more intense within-sector competition in opera and general performing arts limits available cash for organizations in those two sectors.
How do socio-demographic characteristics of the community affect performance?
- Available cash is more constrained for organizations in communities with a higher socioeconomic level and for those with a higher percentage of people under 25, Asian-American, African-American, or Hispanic/Latino.
What impact does Public Funding have on performance?
- Government grant activity in the local market had no effect on available cash.
What Drives Total Expenses (before depreciation)?
What organizational characteristics affect this performance?
- Higher total expenses – i.e., larger budgets – occur for older organizations, those with higher levels of local and state funding, a greater percentage of expenses spent on occupancy costs, more programmatic offerings, more members and/or subscribers, and a larger staff. Expenses also tend to be relatively higher for organizations that target kids, young adults, or Hispanics/Latinos.
- An organization’s arts and cultural sector has a big influence on its expected level of total expenses.
- When organizations target Asian-Americans or offer a higher level of local or world premieres, expenses tend to be Asian-Americans.
How do community arts and leisure characteristics affect performance?
- Expenses tend to be higher for organizations in communities with higher levels of total arts dollar activity, more public broadcast activity, and more leisure activities, which in this case act as complements.
- Having more organizations that compete in the arts education, community, dance, music, opera, PAC, orchestras, theatre, and general performing arts sectors drives down expenses for all organizations in the sector. In other words, the competition makes it more difficult for organizations in these sectors to grow in budget size.
How do socio-demographic characteristics of the community affect performance?
- Total expenses are higher for organizations in more densely populated communities, more philanthropic communities, and where the percentage of the population that is under 25 or Asian American is higher.
- As the percentage of the population that is African American increases, total expenses tend to be lower.
What impact does Public Funding have on performance?
- Where there is higher overall state and federal grant activity in the local marketplace, organizations tend to have larger budgets.
Total Engagement Index
What Drives Total Community Engagement?
The driving force factors from the A&C Ecosystem explain 15% of community engagement, whether the touch points occurred in-person or virtually through digital programming. 37% is driven by the expertise at cultivating relationships and attracting people to become engaged with the organization, and 48% is attributable to random variation.

For a listing of What Drives Performance from the A&C Ecosystem, see the Index-Specific Drivers for this Index?
What Drives Total Engagement?
What organizational characteristics affect this performance?
- More engagement emerges for organizations that are older, own their space, with larger budgets, have more square footage, or provide more program offerings.
- Local and world premieres elevate the number of total touch points.
- Organizations that spend more on fundraising and those that target kids engage more people, and those targeting African-Americans or young adults engage fewer.
- Local funding support increased engagement figures while state dollars had no effect, and the number of NEA and IMLS grants had a positive effect on an organization’s number of total touch points.
How do community arts and leisure characteristics affect performance?
- Any individual organization’s number of total touch points is negatively affected by the number of leisure activities. Evidently, there are strong effects between arts and cultural organizations and substitute leisure activities when it comes to participation.
- As the percentage of independent artists and arts providers in the community increase, total touch points go down.
- There are no competitive effects from similar organizations in the same sector, and total arts revenue per capita in a sector drives up total touch points for organizations.
How do socio-demographic characteristics of the community affect performance?
- The higher the population, the greater the general presence of people under 25 years old in the market, and the higher the median age in the market, the lower total touch points.
- The higher the percentage of the population Hispanic/Latino, the higher the touch points.
- The more households with income $200,000 and above, the lower total engagement, perhaps a reflection of this segment and limited time.
In-Person Engagement Index
What Drives In-Person Engagement?
The driving force factors from the A&C Ecosystem explain 18% of in-person community engagement. 39% is driven by the expertise at cultivating relationships and attracting people to become engaged with the organization, and 43% is attributable to random variation.

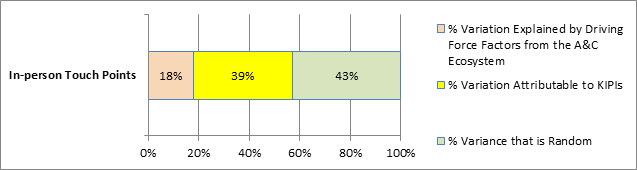
For a listing of What Drives Performance from the A&C Ecosystem, see the Index-Specific Drivers for this Index?
What Drives In-Person Engagement?
What organizational characteristics affect this performance?
- The total number of in-person touch points rises with organizational age, budget size, square footage, and number of program offerings provided.
- Local premieres elevate the number of in-person touch points while national or world premieres lower it.
- Organizations that spend more on marketing, attract more people to view their web pages, have more members or subscribers, and target kids or Asian-Americans engage more people, and those targeting African-Americans or young adults engage fewer.
- Local and state funding support increased in-person engagement figures, and the number of NEA and IMLS grants had a positive effect on an organization’s number of in-person touch points.
How do community arts and leisure characteristics affect performance?
- Public broadcast dollar activity boosts in-person engagement. Any individual organization’s number of total touch points is negatively affected by the number of artists and arts providers in the market.
- The more arts education organizations, art museums or theatre companies in a market, the lower the in-person engagement by organizations within these sectors. Within-sector competition in general performing arts tends to increase the total touch points of organizations in that sector.
How do socio-demographic characteristics of the community affect performance?
- The higher the population, the greater the general presence of people under 25 years old in the market, and the higher the median age in the market, the lower total touch points.
- The higher the percentage of the population Asian-American or African-American, the lower the number of in-person touch points.
- As socioeconomic levels increase, total touch points go down.
What impact does Public Funding have on performance?
- Higher levels of state and federal government grant activity in the local market are associated with lower total in-person touch points.
People per Offerings Index
What Drives In-Person Engagement?
The driving force factors from the A&C Ecosystem explain 10% of in-person community engagement. 20% is driven by the expertise at cultivating relationships and attracting people to become engaged with the organization, and 70% is attributable to random variation.
What Drives Total Offerings?
The number of total programmatic offerings is driven 9% by factors from the A&C Ecosystem. Another 54% of attendance is attributable to expertise in deciding the right number of offerings to provide, and 37% is attributable to random variation.

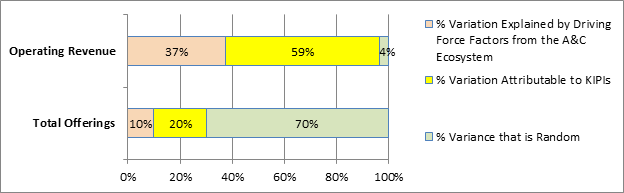
For a listing of What Drives Performance from the A&C Ecosystem, see the Index-Specific Drivers for this Index?
What Drives In-Person Engagement?
What organizational characteristics affect this performance?
- The total number of in-person touch points rises with organizational age, budget size, square footage, and number of program offerings provided.
- Local premieres elevate the number of in-person touch points while national or world premieres lowers it.
- Organizations that spend more on marketing, attract more people to view their web pages, have more members or subscribers, and target kids or Asian-Americans engage more people, and those targeting African-Americans or young adults engage fewer.
- Local and state funding support increased in-person engagement figures, and the number of NEA and IMLS grants had a positive effect on an organization’s number of in-person touch points.
How do community arts and leisure characteristics affect performance?
- Public broadcast dollar activity boosts in-person engagement. Any individual organization’s number of total touch points is negatively affected by the number of artists and arts providers in the market.
- The more arts education organizations, art museums or theatre companies in a market, the lower the in-person engagement by organizations within these sectors. Within-sector competition in general performing arts tends to increase the total touch points of organizations in that sector.
How do socio-demographic characteristics of the community affect performance?
- The higher the population, the greater the general presence of people under 25 years old in the market, and the higher the median age in the market, the lower total touch points.
- The higher the percentage of the population Asian-American or African-American, the lower the number of in-person touch points.
- As socioeconomic levels increase, total touch points go down.
What impact does Public Funding have on performance?
- Higher levels of state and federal government grant activity in the local market are associated with lower total in-person touch points.
What Drives Total Offerings?
What organizational characteristics affect this performance?
- Organizational age, square footage, budget size, available working capital, higher occupancy expenses, and being in a capital campaign all lead to more programmatic offerings. More offerings also occur when organizations target kids, Hispanics/Latinos, or they have been awarded NEA or IMLS grants.
- When there are more local or world premieres presented, there tend to be fewer total offerings. This is also the case when organizations target young adults or African-Americans, or they have higher revenue from interest and dividends.
How do community arts and leisure characteristics affect performance?
- Total offerings tend to be more numerous for organizations in communities with more public broadcast dollar activity and higher total arts dollar activity.
- The more organizations in the music sector, the more offerings music organizations tend to provide. By contrast, having more within-sector competitors in arts education, community, opera, PACs, symphony orchestras or ‘other’ museums tends to result in organizations in those sectors offering fewer programs.
How do socio-demographic characteristics of the community affect performance?
- There are more offerings per organization in communities where the socioeconomic level and median age are high, and where there is a higher percentage of a young adults, African-Americans, or Hispanics/Latinos.
- When communities have a higher percentage of the population that is Asian-American or under the age of 18, total offerings tend to be lower.
What impact does Public Funding have on performance?
- Higher state and federal government grant activity in the local market is related to lower total offerings.
Visitor-to-Staff Index
What Drives Total In-person Attendance?
The driving force factors from the A&C Ecosystem explain 18% of total attendance by those who participate in the organization’s offerings in-person. Another 37% of attendance is attributable to expertise in attracting attendees, and 45% is attributable to random variation.
What Drives the Number of Full-time Employees?
The driving force factors from the A&C Ecosystem explain 34% of the level of total full-time employees. Another 58% of variation in the number of full-time employees is attributable to expertise in setting and managing the level that is best for the organization, and 8% is attributable to random variation.

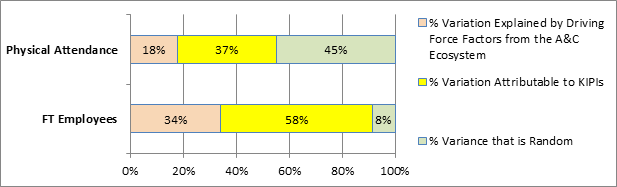
For a listing of What Drives Performance from the A&C Ecosystem, see the Index-Specific Drivers for this Index?
What Drives In-person Attendance?
What organizational characteristics affect this performance?
- In-person attendance increases with organizational age, square footage, budget size, the number of local and national premieres, the amount spent on marketing, the number of members, the number of website page views, and being awarded NEA or IMLS grants.
- Attendance tends to be higher when organizations receive higher levels of support from local government, and when the organization targets either kids or Asian Americans.
- Attendance tends to be lower for organizations that target young adults or African Americans.
- Attendance is negatively affected when the lowest ticket price is still relatively high.
How do community arts and leisure characteristics affect performance?
- In-person attendance tends to be higher for organizations in communities with high total arts dollar activity, and more leisure activities, which act as complements.
- Attendance tends to be lower for organizations in communities with more artists and arts providers or more public broadcast dollar activity.
- The greater the number of within-sector competitors the lower the attendance for organizations within the sectors.
How do socio-demographic characteristics of the community affect performance?
- Physical attendance is higher in communities where the total population is larger. It tends to be lower when the socioeconomic level and median age are higher. It is also lower if the organization is in a market with a higher percentage of the population under 25, Hispanic/Latino or African-American.
What impact does Public Funding have on performance?
- Physical attendance is lower in communities with higher state and federal government grant activity in the local market.
What Drives the Number of Full-time Employees?
What organizational characteristics affect this performance?
- The number of full-time employees that an organization has tends to increase with its age, square footage, budget size, board size, occupancy expenses, the number of programmatic offerings, amount of total investments, and top ticket price.
- Organizations that target people under 18 years old or African American, and those awarded NEA or IMLS grants tend to have more full-time employees.
- The number of full-time employees tends to be lower for organizations that present higher levels of local and world premieres and for those who target Asian-Americans.
How do community arts and leisure characteristics affect performance?
- An organization’s number of full-time employees tends to be higher for organizations in communities with higher total arts dollar activity and more leisure activities, which act as complements in this case.
- More artists and arts providers in a community drive down the number of full-time employees, as does more public broadcast activity.
- The higher within-sector competition in every sector, the lower the number of full-time employees.
How do socio-demographic characteristics of the community affect performance?
- An organization’s number of full-time employees rises when there is a higher percentage of young adults in the community and with larger total population. The number is lower in communities where the socioeconomic level is higher.
What impact does Public Funding have on performance?
- Organizations tend to have more full-time employees in communities with higher state and federal government grant activity in the local market.
[1] The AVERAGES section of this report focuses only on the 11, fairly clear-cut arts and cultural sectors. Here we include organizations in the ‘Miscellaneous’ category since they are part of the larger fabric of arts and culture in the U.S., often reaching very broad audiences with popular offerings. It is a very varied group, including everything from historical preservation sites to film festivals, and it’s a big sector, representing 15% of the total number of organizations.
[2] Complements are other businesses that positively affect performance; for example, hotels in the immediate area support tourism and may increase arts and culture attendance. Substitutes are other organizations or businesses that compete for resources and replace each other in use or consumption; for example, cinemas represent a possible substitute for nonprofit arts entertainment. Competition is within-sector; for example, theaters have direct competitive effects on other theaters in the community but not art museums.